Arpit Mathur
Ph.D. student at CMU
Hi, I'm Arpit! I'm a Ph.D. student at Carnegie Mellon University's Human-Computer Interaction Institute, advised by Adam Perer. I'm looking for research internships for Summer 2027.
I design and build human-centered AI systems for high-stakes domains like healthcare. My work combines Human-AI Collaboration, Data Visualization, and Applied Machine Learning. I build end-to-end prototypes, with my skillset spanning user research, interaction design, front-end development, and evaluation with real users.
Before CMU, I earned a B.Des from IIT Guwahati and an M.S. in HCI from Georgia Tech. I worked as a UX Designer at MathWorks on MATLAB and Simulink.
Outside research, I like making games and am an avid Arsenal fan.
projects
PHORA: AI Survival Predictions in PAH Care
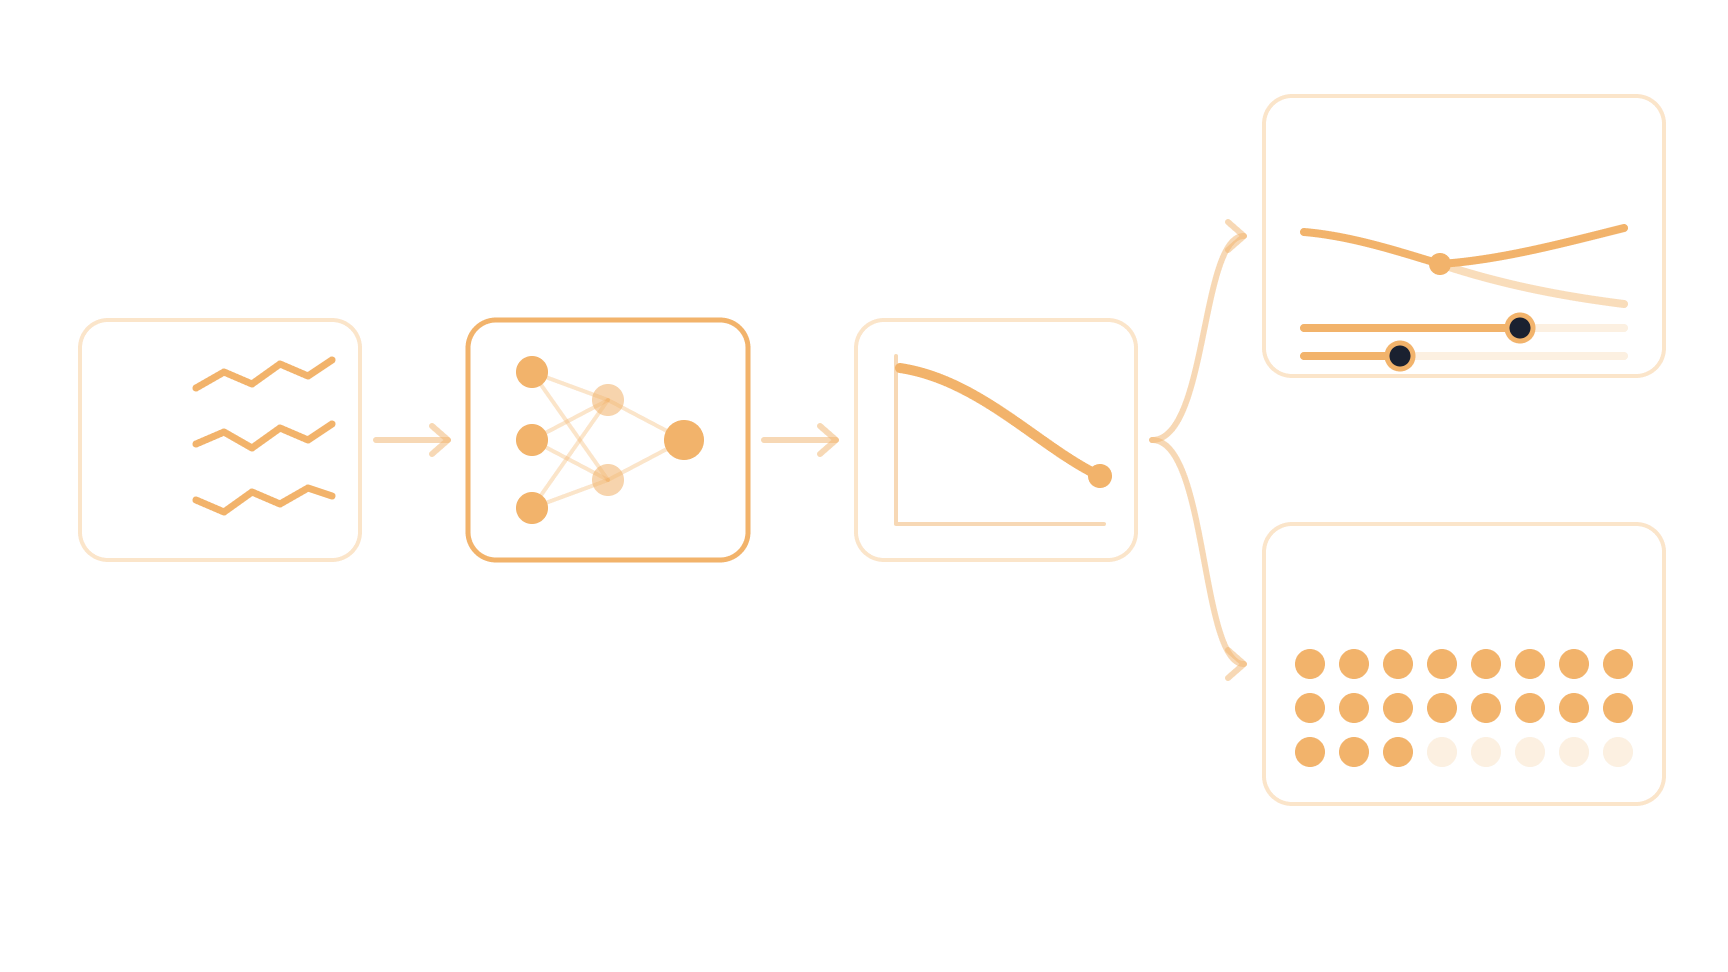
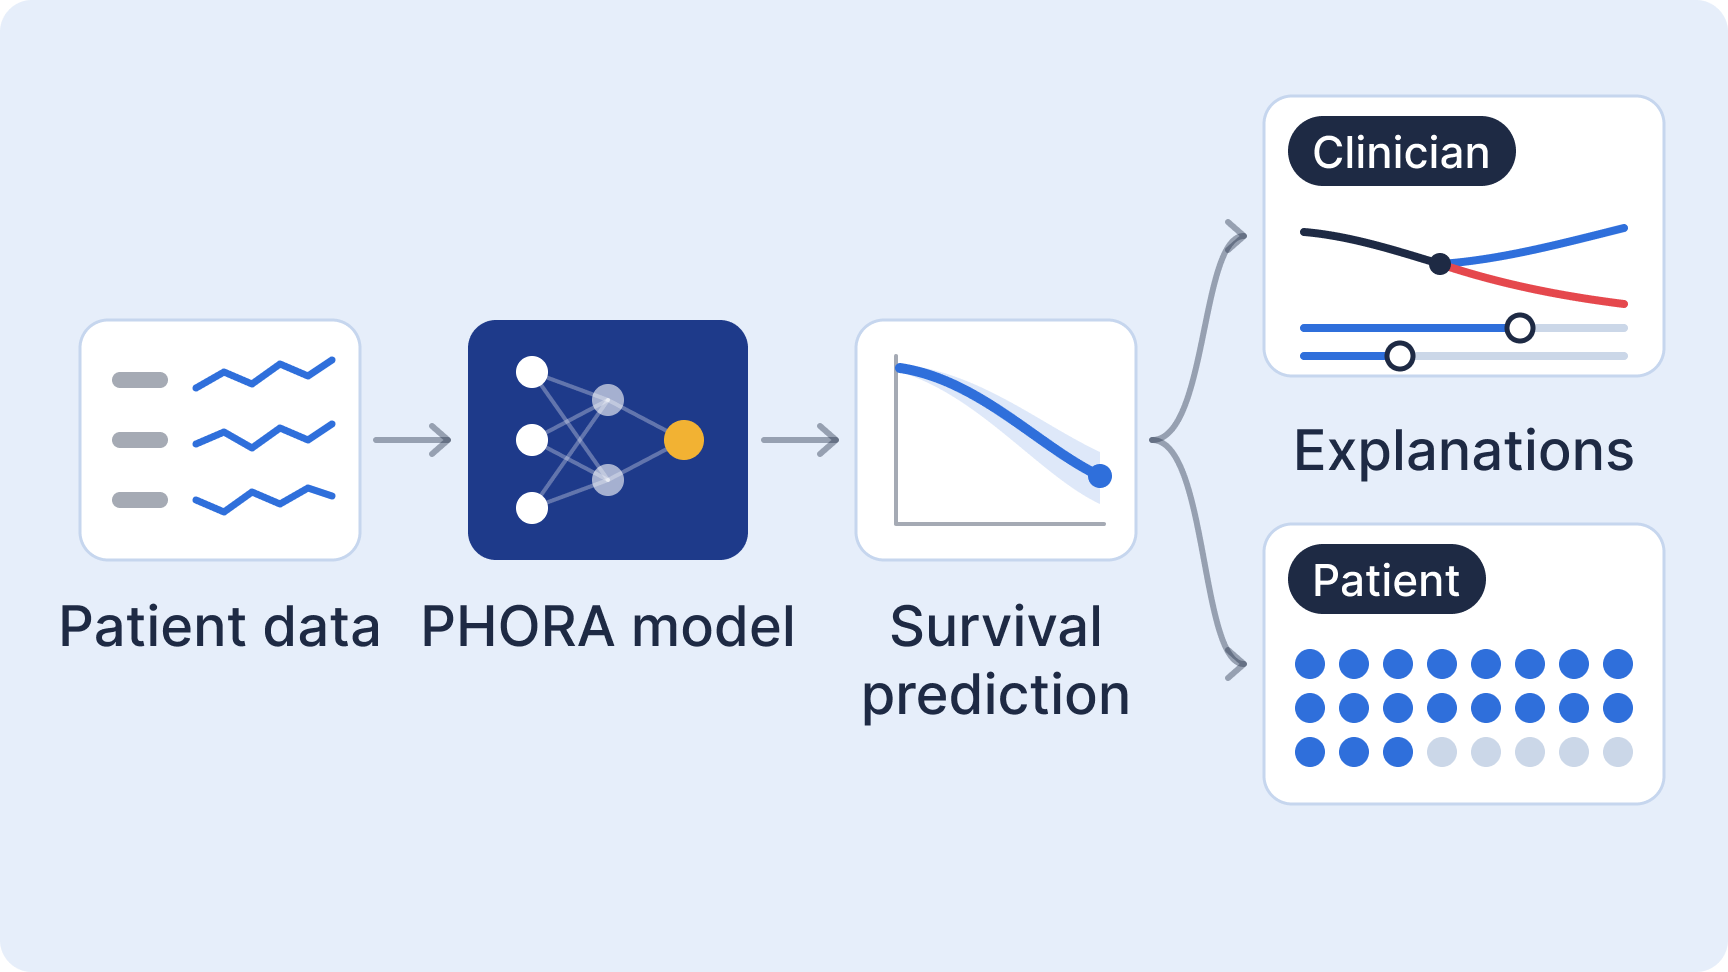
Two systems built on the PHORA risk model for pulmonary arterial hypertension: a clinician dashboard for counterfactual reasoning about survival predictions, and ourPHORA, a patient-facing redesign. We evaluated ourPHORA with 44 patients and caregivers; an in-clinic study pairing patients with their clinicians is ongoing.
Clinical Decision Support
Human-AI Interaction
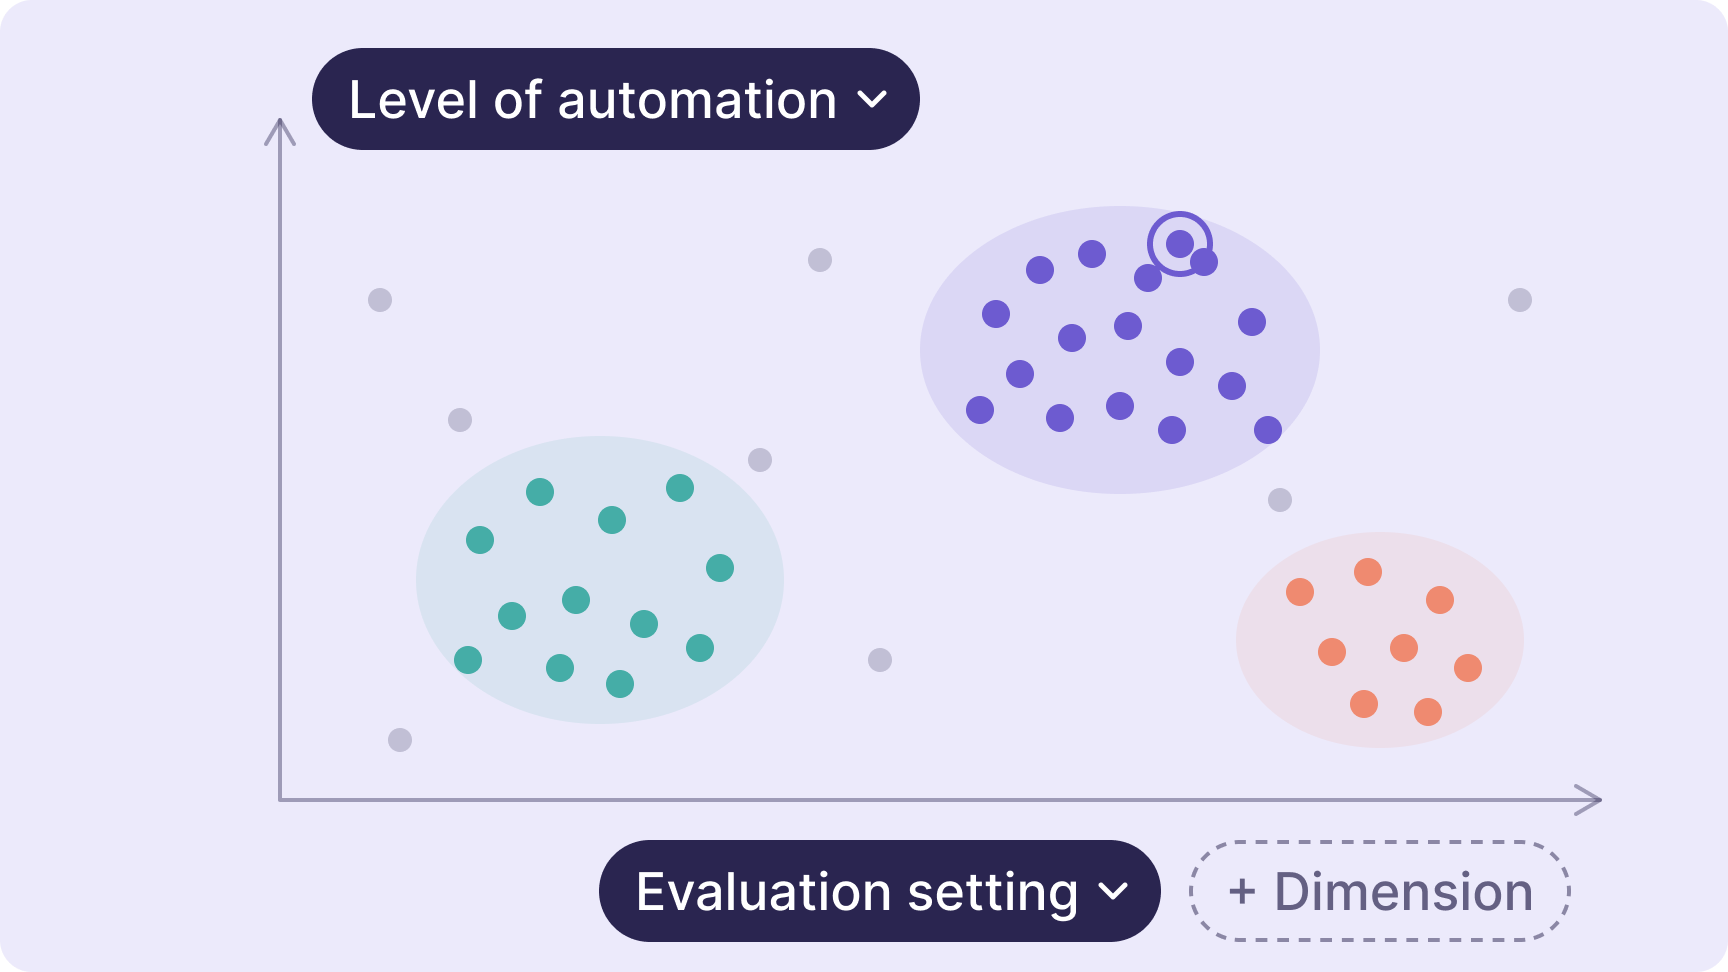
AXES: Co-Constructing Semantic Dimensions for Literature Exploration
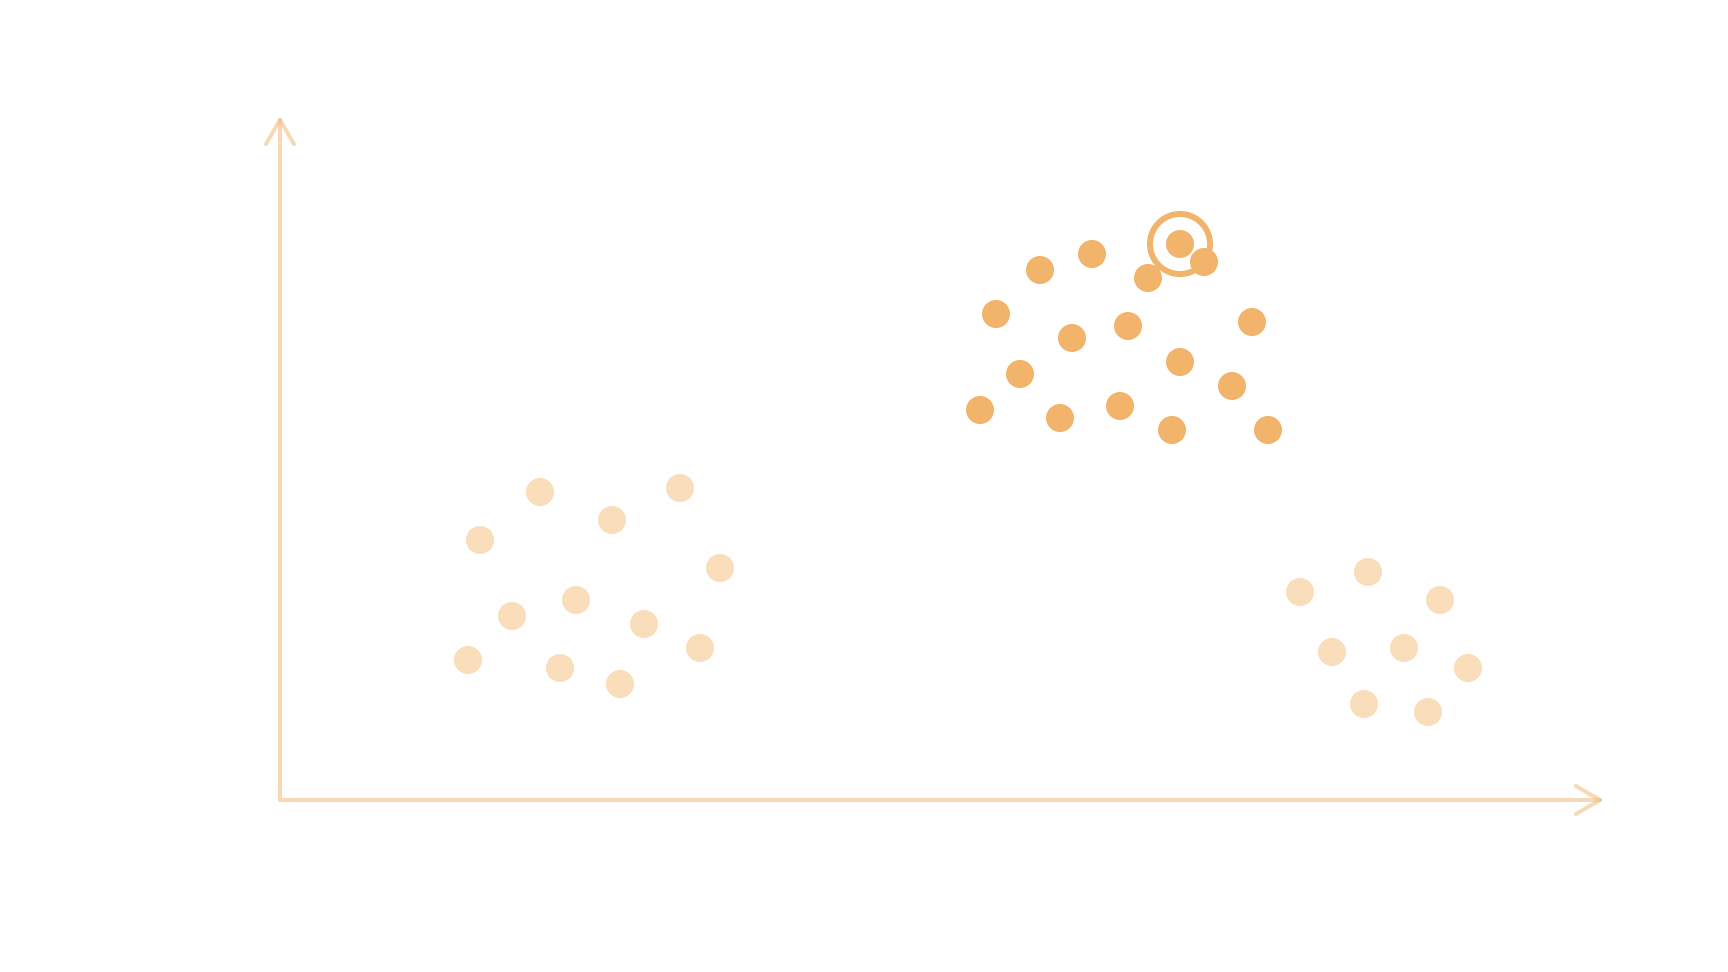
A literature visualization tool that turns the dimensions researchers use to compare papers into explicit, editable scatterplot axes. These can be explicitly defined, or surfaced from related work. In an evaluation with 15 participants, we found that AXES supported both bottom-up and top-down analysis of literature.
Visual Analytics
Human-AI Interaction
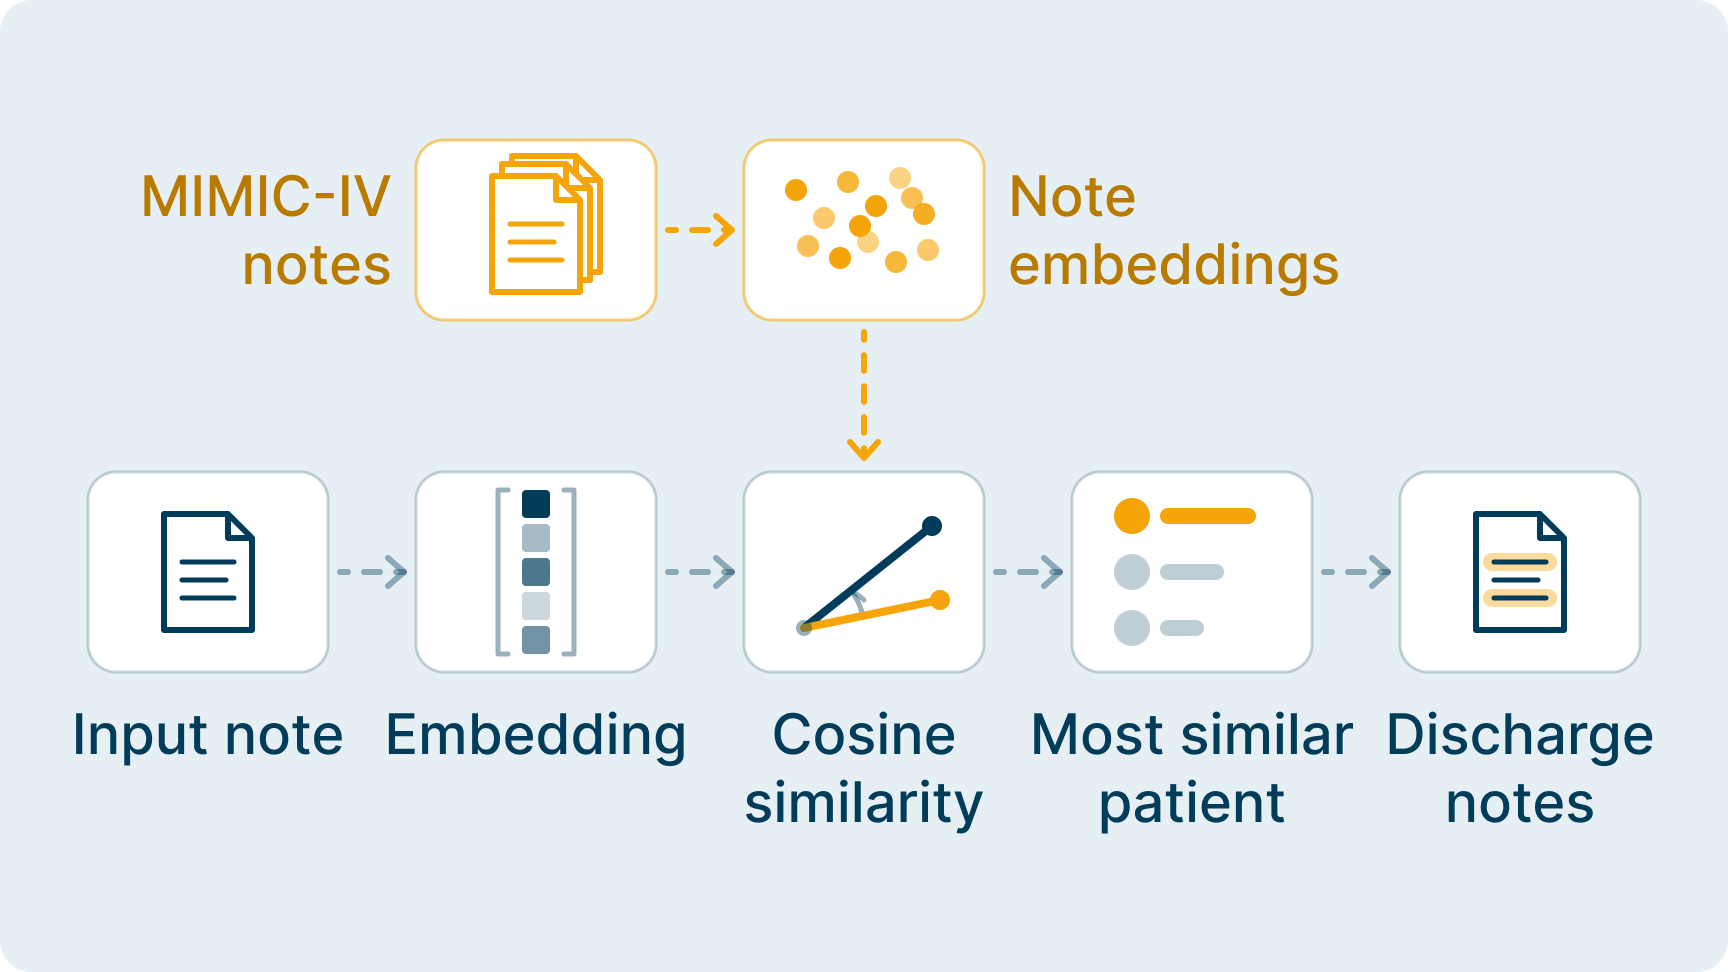
Clini-Compare: Patient Similarity from Radiology Notes
A visualization tool that helps physicians reason about complex cases by surfacing semantically similar patients from unstructured radiology notes, supporting clinical sensemaking, trust, and decision-making.
Clinical Decision Support
Sensemaking
Visual Analytics
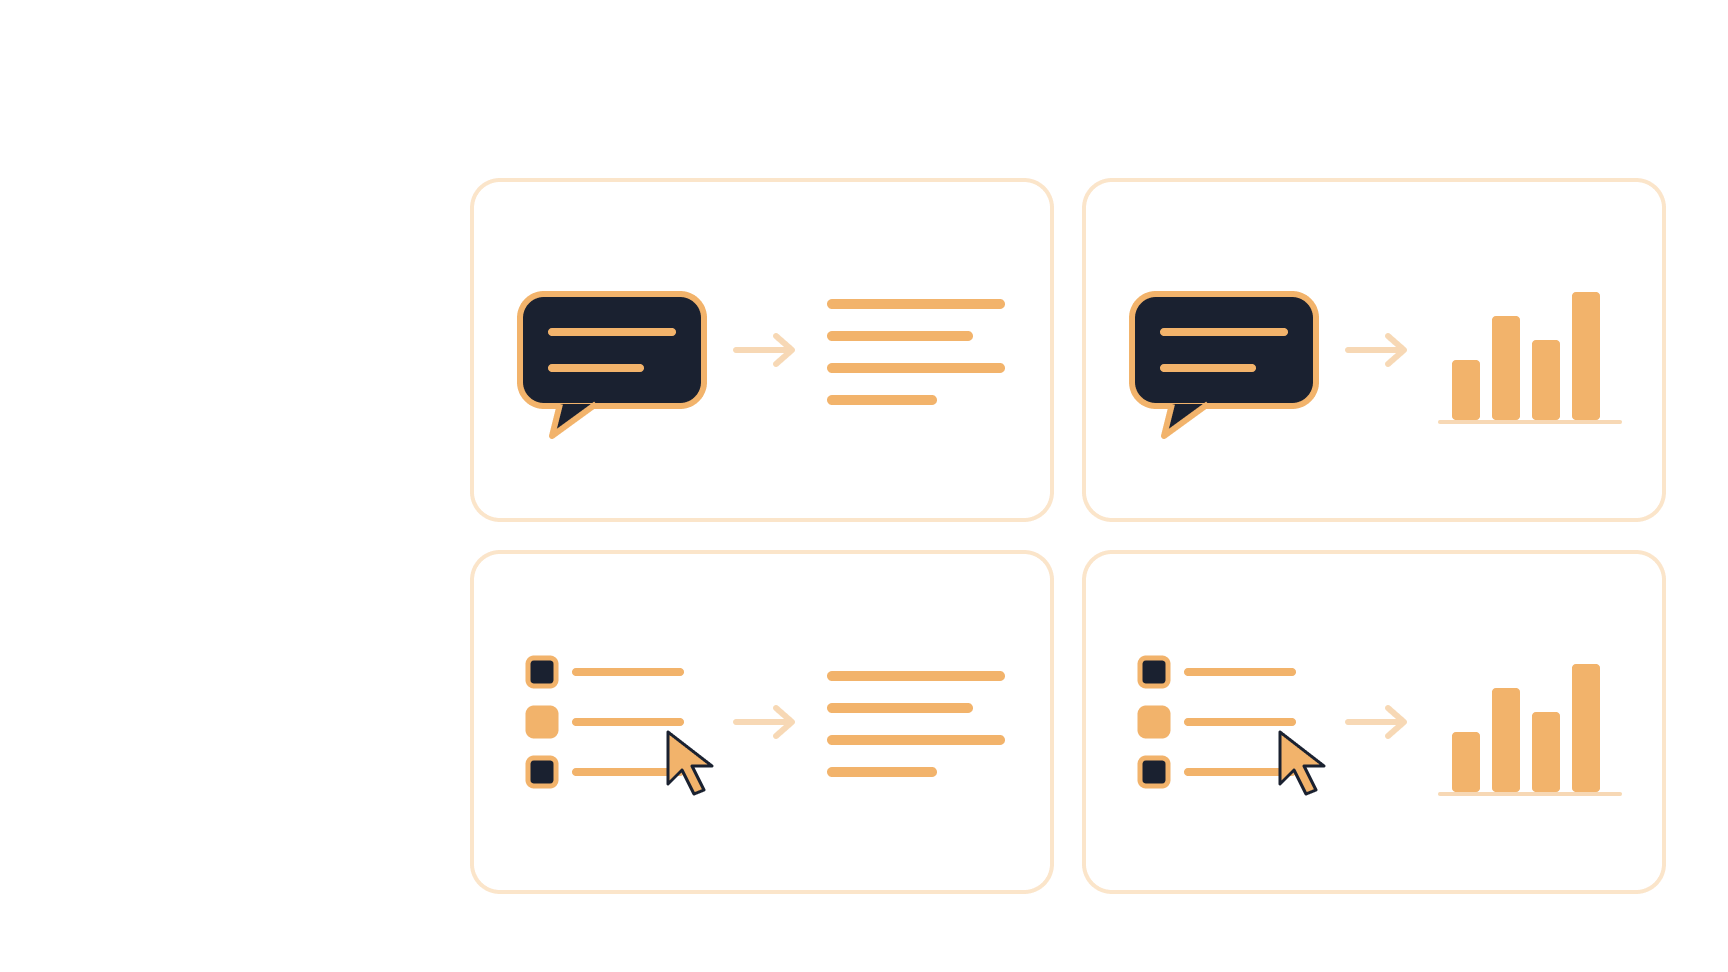
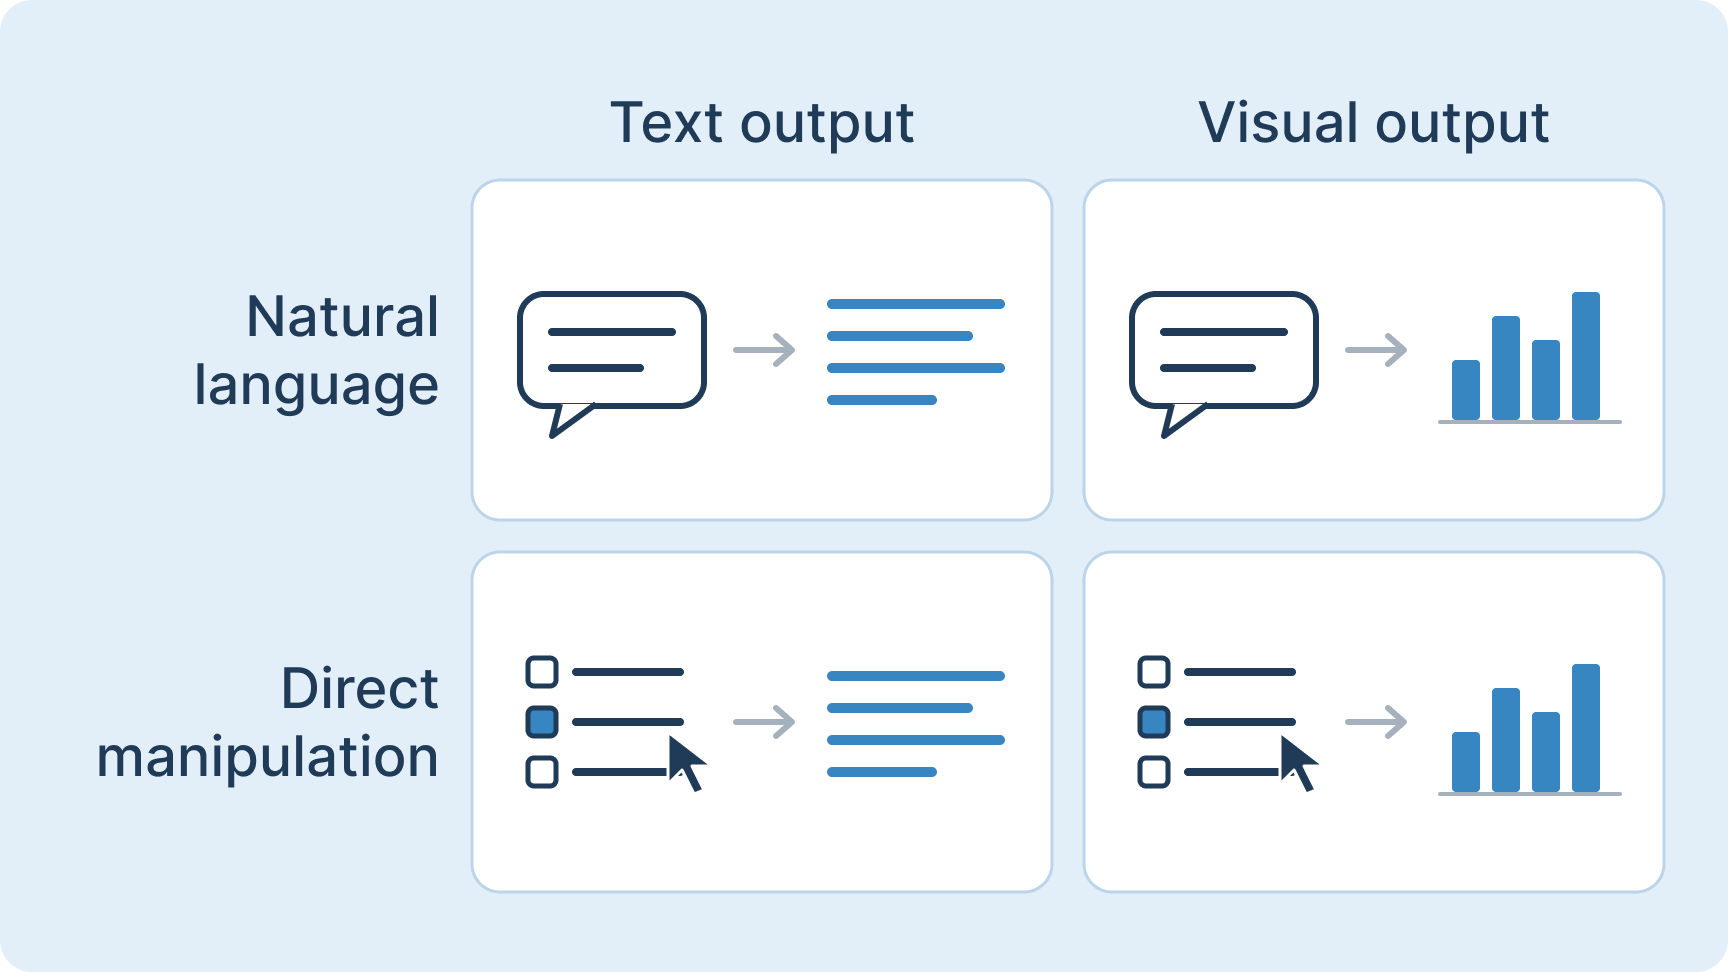
cBioChat: How Interaction Modality Shapes Genomic Data Exploration
cBioChat brings LLM-driven natural-language interaction to cBioPortal. With Memorial Sloan Kettering Cancer Center, we run a controlled 2×2 study that separates how researchers express intent from how results are presented, measuring how each shapes exploration, verification, and trust.
LLMs
Human-AI Interaction
Visual Analytics
publications
AIES 2025
A Human-Centered Approach to Identifying Promises, Risks, & Challenges of Text-to-Image Generative AI in Radiology
Katelyn Morrison, Arpit Mathur, Aidan Bradshaw, Tom Wartmann, Steven Lundi, Afrooz Zandifar, Weichang Dai, Kayhan Batmanghelich, Motahhare Eslami, Adam Perer
Generative AI
Radiology
Healthcare Technology
Education
CHI 2025
Exploratory Visual Analysis of Transcripts for Interaction Analysis in Human-Computer Interaction
Ben Rydal Shapiro, Rogers Hall, Arpit Mathur, Edwin Zhao
HCI
Visualization
Qualitative Methods
Transcripts
CHI 2025 (WORKSHOP)
Clini-Compare: An Interactive Patient-Similarity Visualization Tool for Clinical Decision Support
Arpit Mathur, Adam Perer
Patient Similarity
Visualization
Decision Support
Healthcare Technology
Arxiv
Texture: Structured Exploration of Text Datasets
Will Epperson, Arpit Mathur, Adam Perer, Dominik Moritz
Text Visualization
Exploratory Data Analysis
Interactive Systems
Dataset Tools
MIDL 2025
Toward Interpretable 3D Diffusion in Radiology: Token-Wise Attribution for Text-to-CT Synthesis
Aidan Bradshaw, Katelyn Morrison, Arpit Mathur, Weicheng Dai, Motahhare Eslami, Kayhan Batmanghelich, Adam Perer
3D Diffusion
Explainable AI
Radiology
Text-to-Image
ICLS 2024
Turn charts for interaction analysis: Visually mapping the conversation floor
Benjamin R. Shapiro, Rogers Hall, Arpit Mathur, Edwin Zhao
Learning Sciences
Interaction Analysis
Human–computer interaction
Information Visualization
ICLS 2022
Interactive Transcription Techniques for Interaction Analysis
Arpit Mathur, Benjamin R. Shapiro
Learning Sciences
Interaction Analysis
Human–computer interaction
Information Visualization
HCII 2021
A Study of Motivation, Preferences, and Pain Points Regarding Participation in Career Related Mentorship
Arpit Mathur, Carrie Bruce
Human-computer interaction
Career development
Human resources
Mentor-Mentee relationships
User research
ICoRD 2021
Development and Evaluation of Usability Heuristics for Voice User Interfaces
Lokesh Fulfagar, Anupriya Gupta, Arpit Mathur, Abhishek Shrivastava
Voice user interfaces
Usability heuristics
Heuristic evaluation
Speech interaction
Conversational interfaces
Human–computer interaction
INTERACT 2019
A Study of Outbound Automated Call Preferences for DOTS Adherence in Rural India.
Arpit Mathur, Shimmila Bhowmick, Keyur Sorathia
Automated calls
IVR
ICTD
HCI4D
Health education
experience
Carnegie Mellon University
Aug 24 - Present
Doctoral Research Assistant
Conducting research at the intersection of Human-Computer Interaction, Machine Learning, Healthcare, and Human-AI Collaboration, focusing on developing innovative solutions in healthcare using advanced data visualization techniques.
The MathWorks, Inc.
Jun 21 - Jun 24
UX Designer
Supporting multiple MATLAB and Simulink products, including MATLAB fixed-point workflows, Simulink Studio, and System Composer. Responsibilities include collaborative design events, wireframing, iterative prototyping and high-fidelity visual design.
Georgia Institute of Technology
Jan 20 - Jul 20
Graduate Research Assistant
Worked with the School of Electrical Engineering, to create course Material for EC 3040 Semiconductor Devices. Created interactive web based visualizations as course materials using D3.js and P5.js.
Aug 20 - May 21
Graduate Teaching Assistant
Served as a Teaching Assistant for CS 4460 Introduction to Information Visualization over Fall 2020 and Spring 2020. Major responsibilities included lecturing, grading, and assisting undergradute students with d3.js and Tableau.
SAS Research and Development
May 18 - Jul 18
UX Design Intern
Redesigned the SAS Analytics Credit Scoring Tool. Conducted Contextual Interviews with Risk Analysts in Indian banks, and used those insights to create high-fidelity sketch mockups.