
AXES: Co-Constructing Semantic Dimensions for Literature Exploration
A literature visualization tool that turns the dimensions researchers use to compare papers into explicit, editable scatterplot axes. These can be explicitly defined, or surfaced from related work. In an evaluation with 15 participants, we found that AXES supported both bottom-up and top-down analysis of literature.
Visual Analytics
Human-AI Interaction
| My role | I led the concept, UI and interaction design, frontend development (SvelteKit + D3), and study design; I ran the study sessions, conducted the qualitative analysis, and contributed to the quantitative analysis. |
| Methods | Interactive visualization design · LLM/RAG pipeline design · within-subjects mixed-methods study · think-aloud · interaction log analysis · inductive thematic analysis and affinity diagramming · SUS and NASA-TLX |
TL;DR. Literature tools decide how papers get compared, and that choice determines which patterns and gaps a researcher can see. I co-designed and evaluated AXES, a system in which those dimensions of comparison are editable objects. Researchers and AI build the dimensions together, and the system places every paper along each one with source evidence. Researchers treated the dimensions as hypotheses to test: 13 of 15 revised how they were framing the literature based on what the system showed them.
Live demo · View code on GitHub
1. The Problem
A literature visualization does more than display papers. Its dimensions determine which clusters, gaps, and relationships are visible. Two researchers reading the same papers on AI-assisted decision making may care about entirely different distinctions.
Existing tools treat the basis of comparison as already settled:
| Approach | What organizes the corpus | Limitation |
|---|---|---|
| Citation and co-authorship maps | Bibliographic links | Limited to relationships already in the scholarly record |
| Topic models and embedding projections | Inferred themes, similarity | Dimensions are opaque: papers cluster, but along what? |
| LLM research tools (Elicit, Consensus) | A question the user asks | Assumes the user already knows what to ask; the question is discarded once answered |
The gap. The basis of comparison is too consequential to leave entirely to the system. Yet researchers often can’t specify it upfront, because figuring out what is worth comparing is part of making sense of a literature.
Research questions
- RQ1: How does making the dimensions of a visualization a first-class object of interaction shape literature sensemaking?
- RQ2: How do researchers divide initiative between their own framing and AI scaffolding?
2. Solution
AXES treats a semantic dimension as the unit of interaction. A semantic dimension is a named, natural-language specification of how papers can differ, together with its value scale. Researchers build dimensions, AXES applies them across the corpus, and the papers rearrange in a scatterplot. When a dimension is revised, the same corpus reorganizes.
Who takes the lead depends on what the researcher can currently articulate:
| Researcher knows… | Pathway | Example |
|---|---|---|
| The distinction they want | (A) Direct specification | Study Population: experts vs. novices |
| A question, but not how to compare papers on it | (B) Intent-based generation | “How do systems prevent over-reliance on AI?” → Timing of AI Advice |
| Not yet what’s interesting | (C) Related-work-based generation | A paper contrasting AI that recommends vs. critiques vs. scaffolds → Role of AI in the Decision Process |
In all three pathways, the researcher decides which dimensions shape the view.
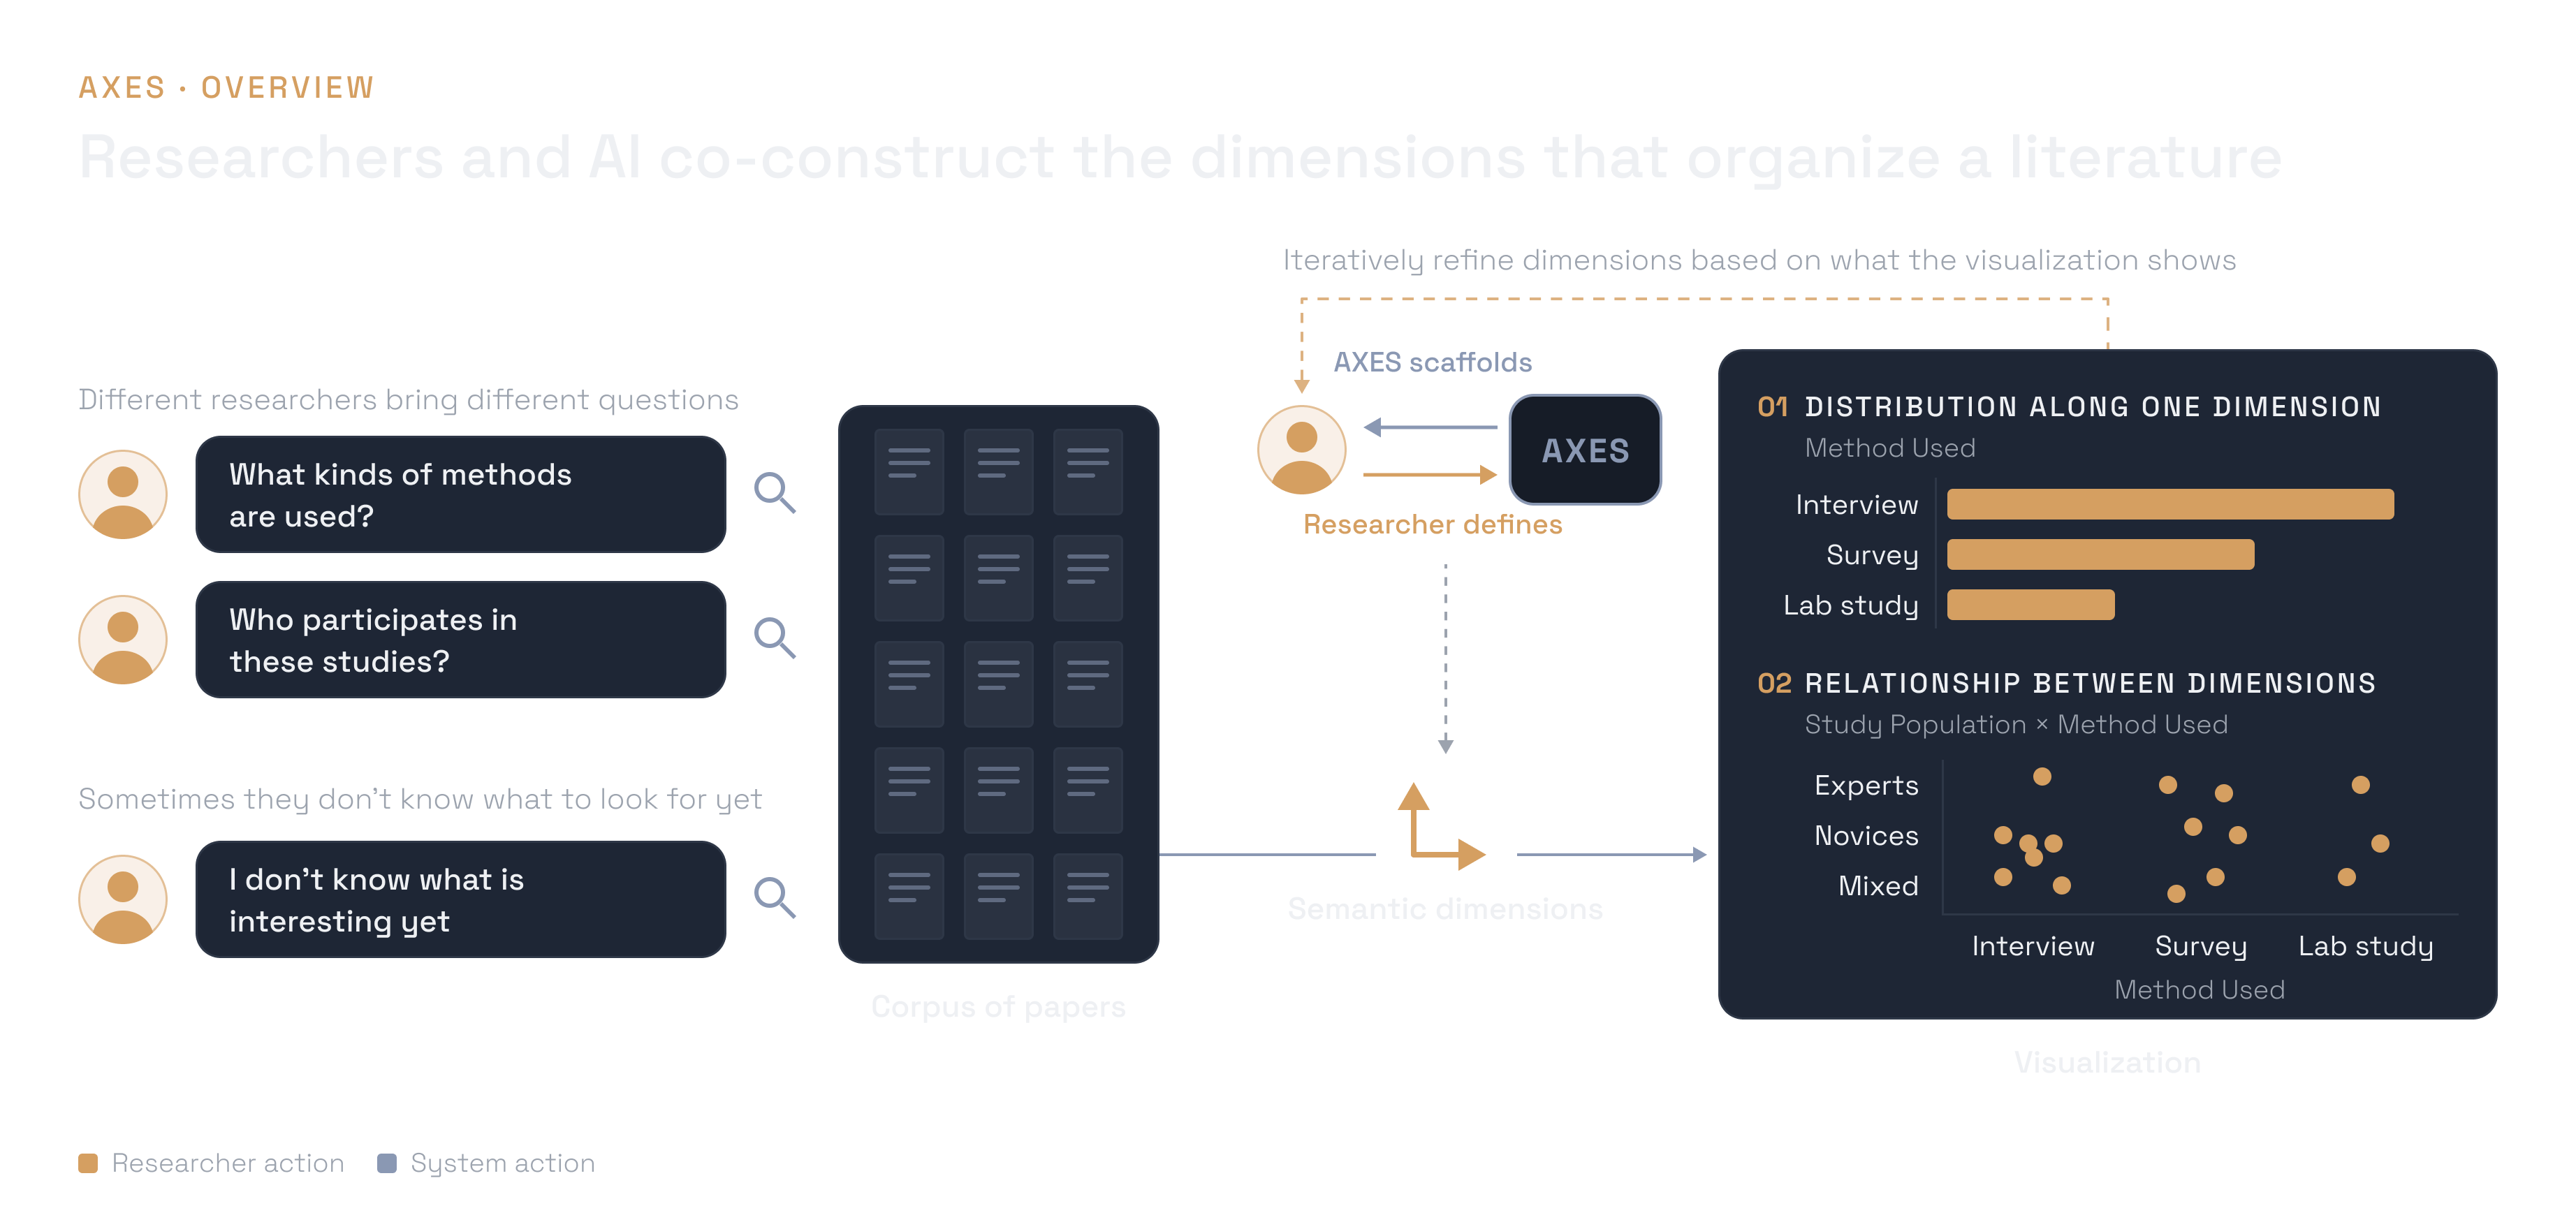
Researchers bring different questions to the same corpus, or don’t yet know what to ask. AXES makes the dimensions of the visualization editable objects that researchers and AI construct together.
3. System Design
I designed AXES around three goals, each drawn from a gap in prior work:
- Make the comparison space explicit and editable. Dimensions are objects the researcher defines, inspects, and revises.
- Scaffold the discovery of dimensions. The system supports researchers who can articulate a comparison and those who can’t yet.
- Make AI assignments traceable. Every value assigned to a paper links to the passages it came from.
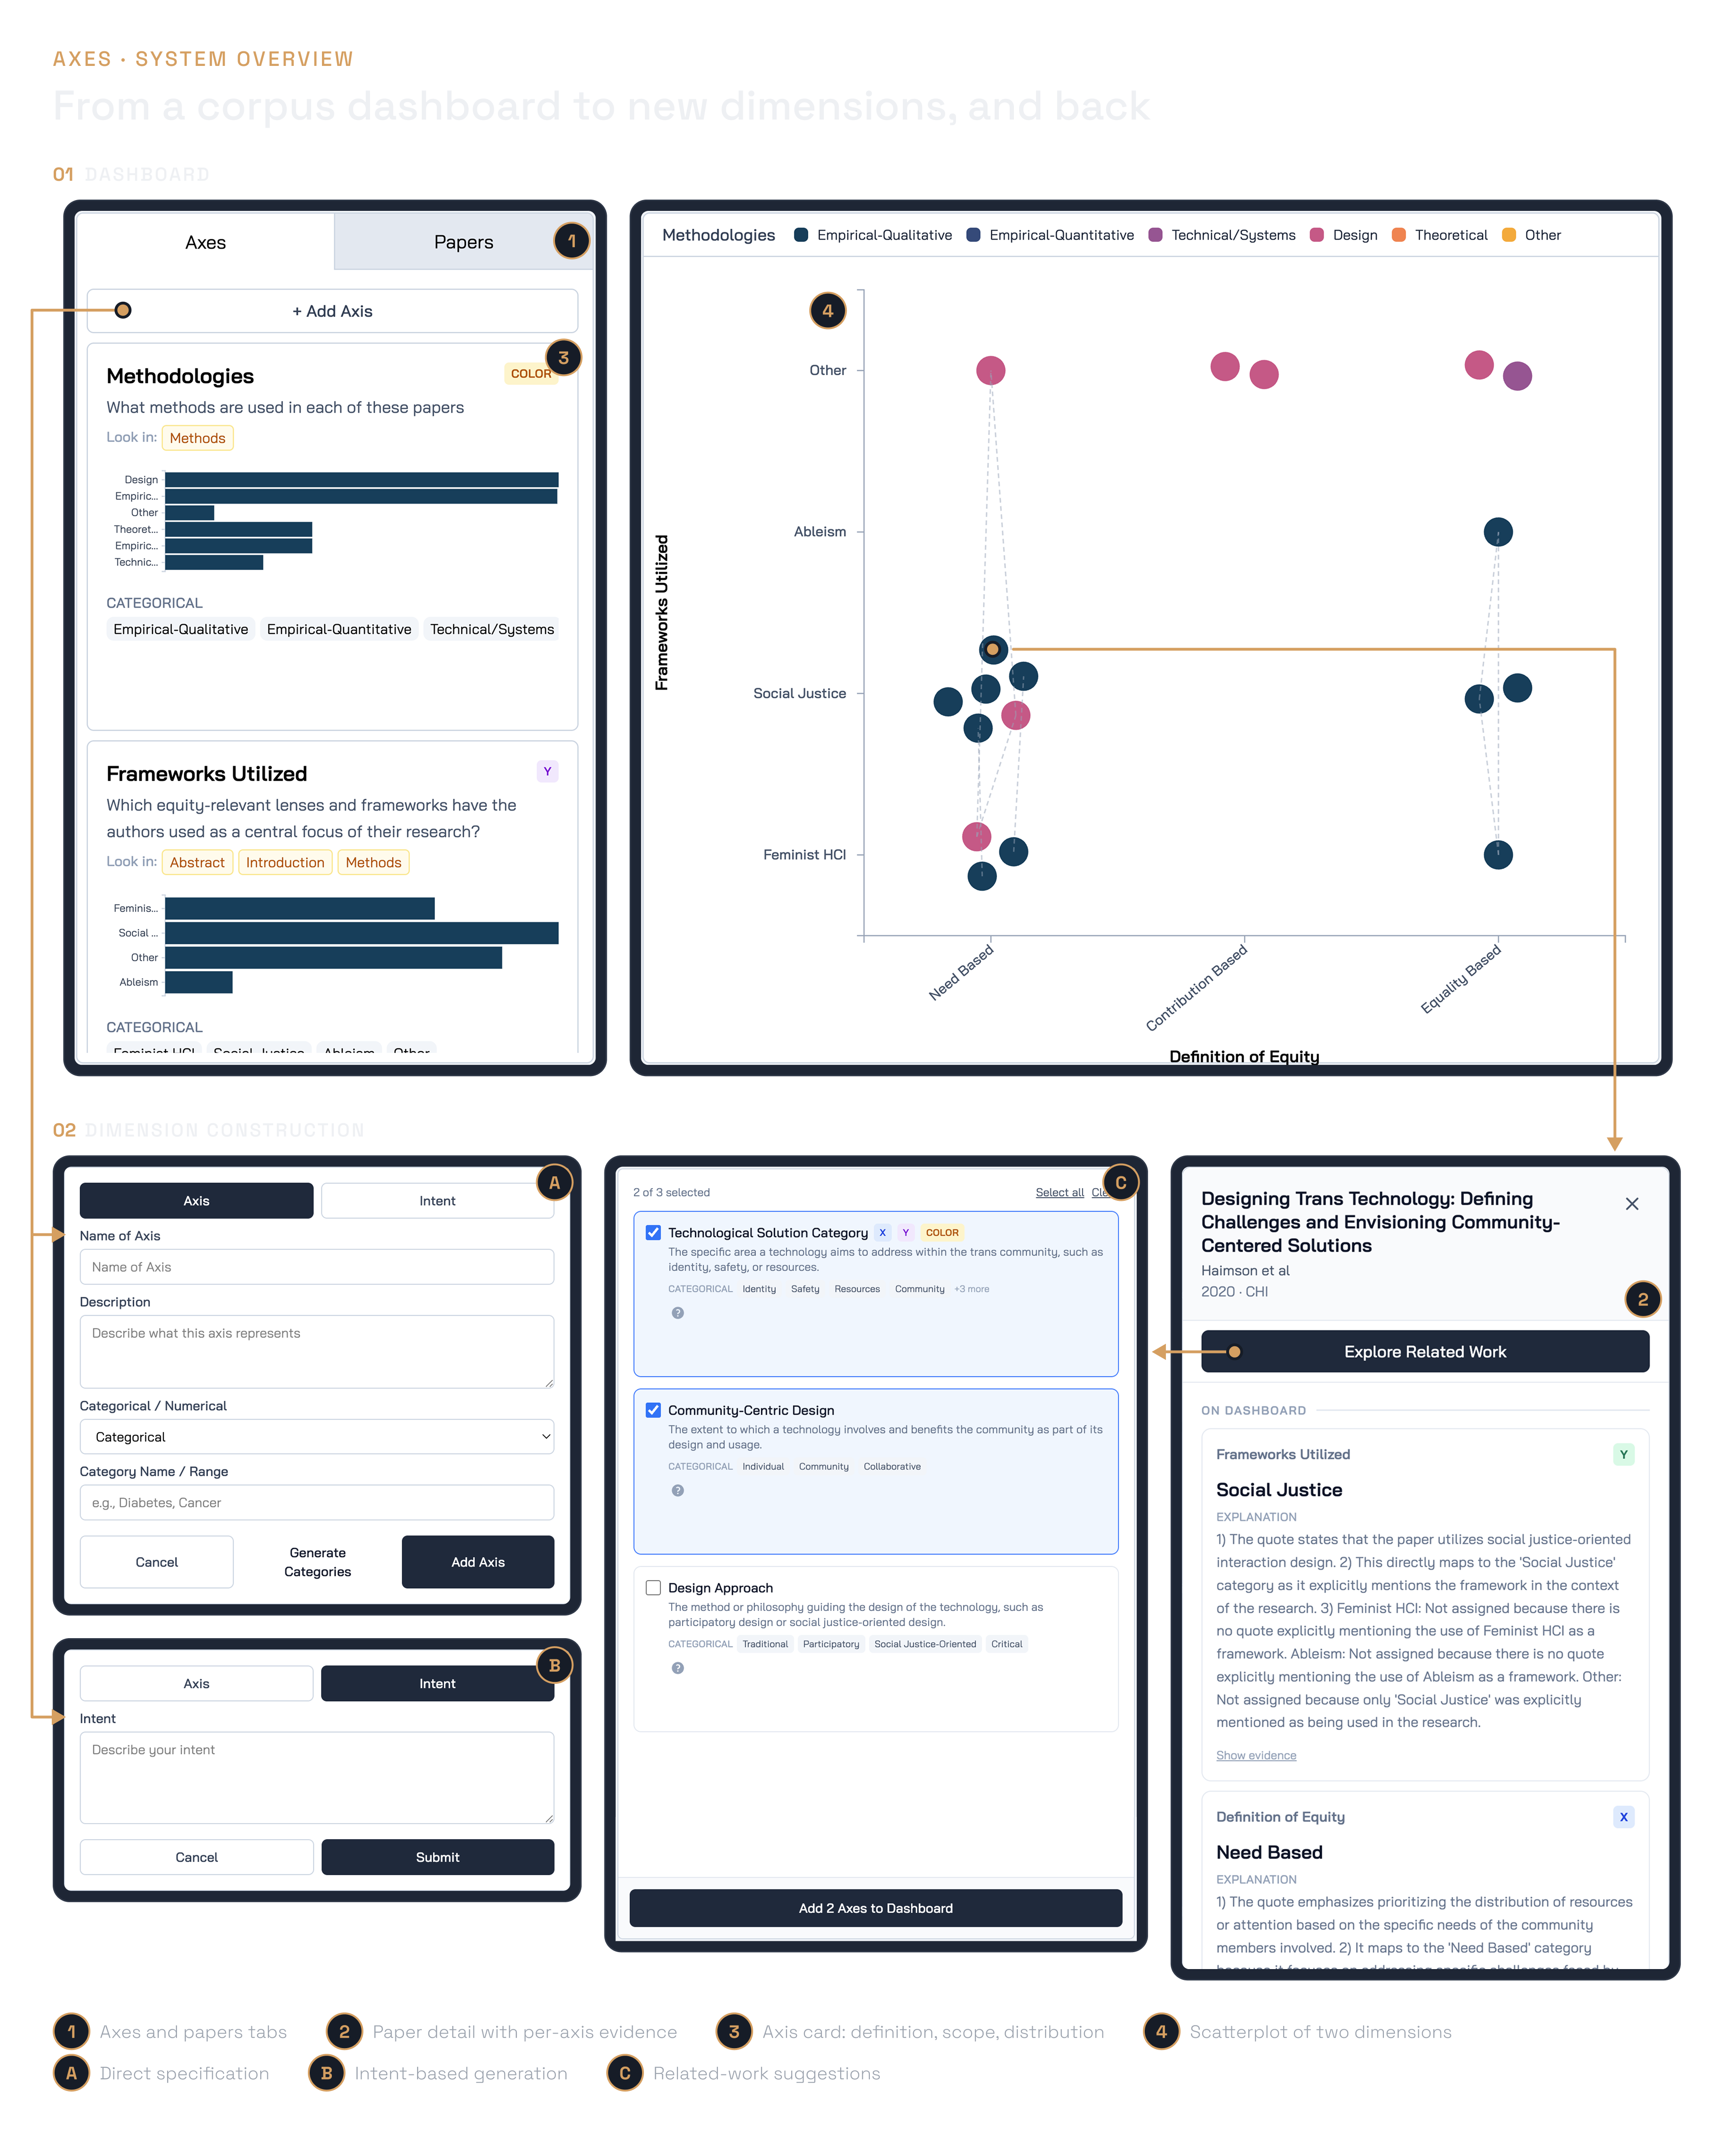
AXES workflow: (1) upload a corpus, (2) explore an individual paper, (3) define and refine dimensions through three pathways, (4) explore the corpus in an interactive scatterplot. Researchers move freely between stages.
Holding the visual encoding constant. I deliberately used a familiar scatterplot. Because the chart type never changes, any change in the view comes from a change in the dimensions.
Technical pipeline.
- Generating dimensions. An LLM recovers the comparison implicit in a paper’s related work. For example, “requires clinician input” vs. “patient-facing” becomes Primary User. The same LLM step also breaks a research goal down into candidate dimensions.
- Mapping papers. A RAG pipeline indexes each paper with section metadata and retrieves from the sections where evidence is likely to appear. It must identify a supporting passage before it assigns a value. If evidence is insufficient, it returns Not stated rather than a guess.
Stack: SvelteKit, D3, Flask, Agno, GPT-4o.
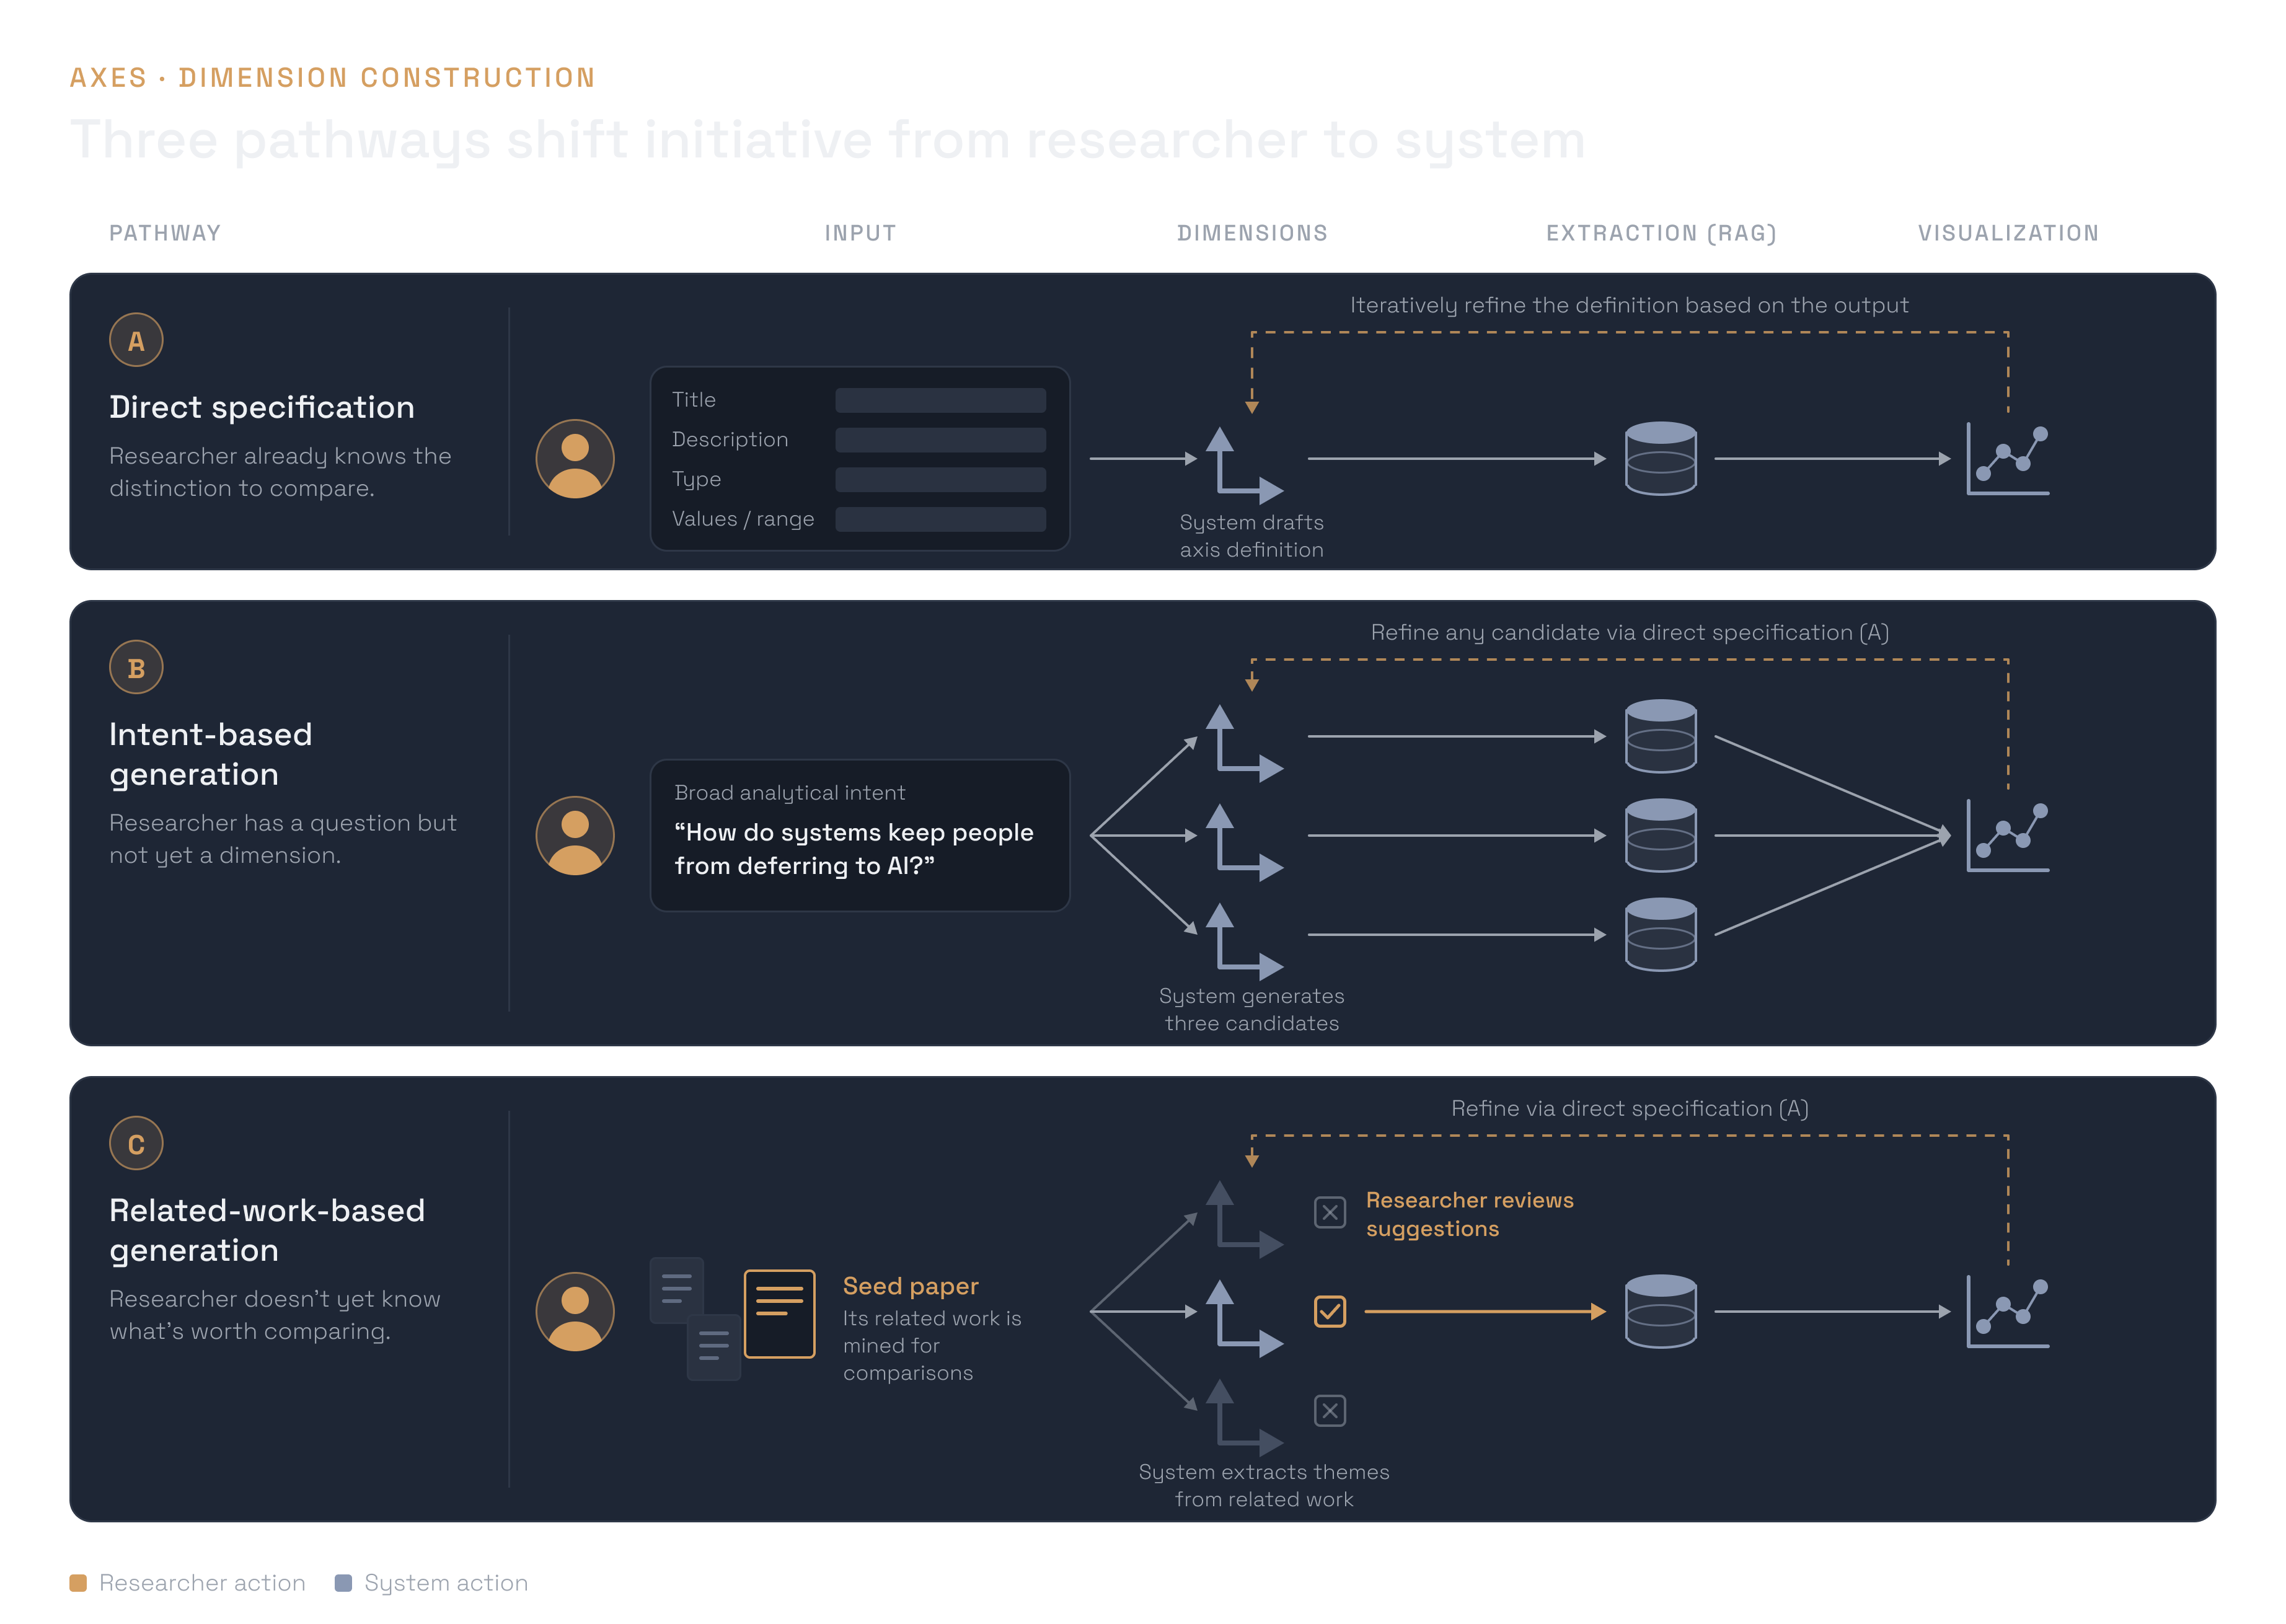
The three pathways shift initiative between researcher (orange) and system (teal).
4. Evaluation
I designed a within-subjects mixed-methods study with 15 researchers (9 PhD students, 5 master’s students, 1 postdoc) from HCI, AI, visualization, software engineering, ECE, and biomedicine. Each participant explored a familiar corpus drawn from their own research and an unfamiliar one, in counterbalanced order. Sessions lasted about 60 minutes. Data came from:
- think-aloud,
- instrumented interaction logs,
- SUS and NASA-TLX,
- semi-structured interviews.
I analyzed the transcripts through inductive thematic analysis and traced the resulting themes against the logs.
The study was exploratory rather than a comparison against a baseline. Literature sensemaking has no canonical workflow, so the goal was to characterize the interaction model itself. Participants created 115 dimensions and revised them 88 times.
The central finding: participants treated dimensions as provisional hypotheses. They tried a comparison, saw what it revealed, then kept, revised, or abandoned it.
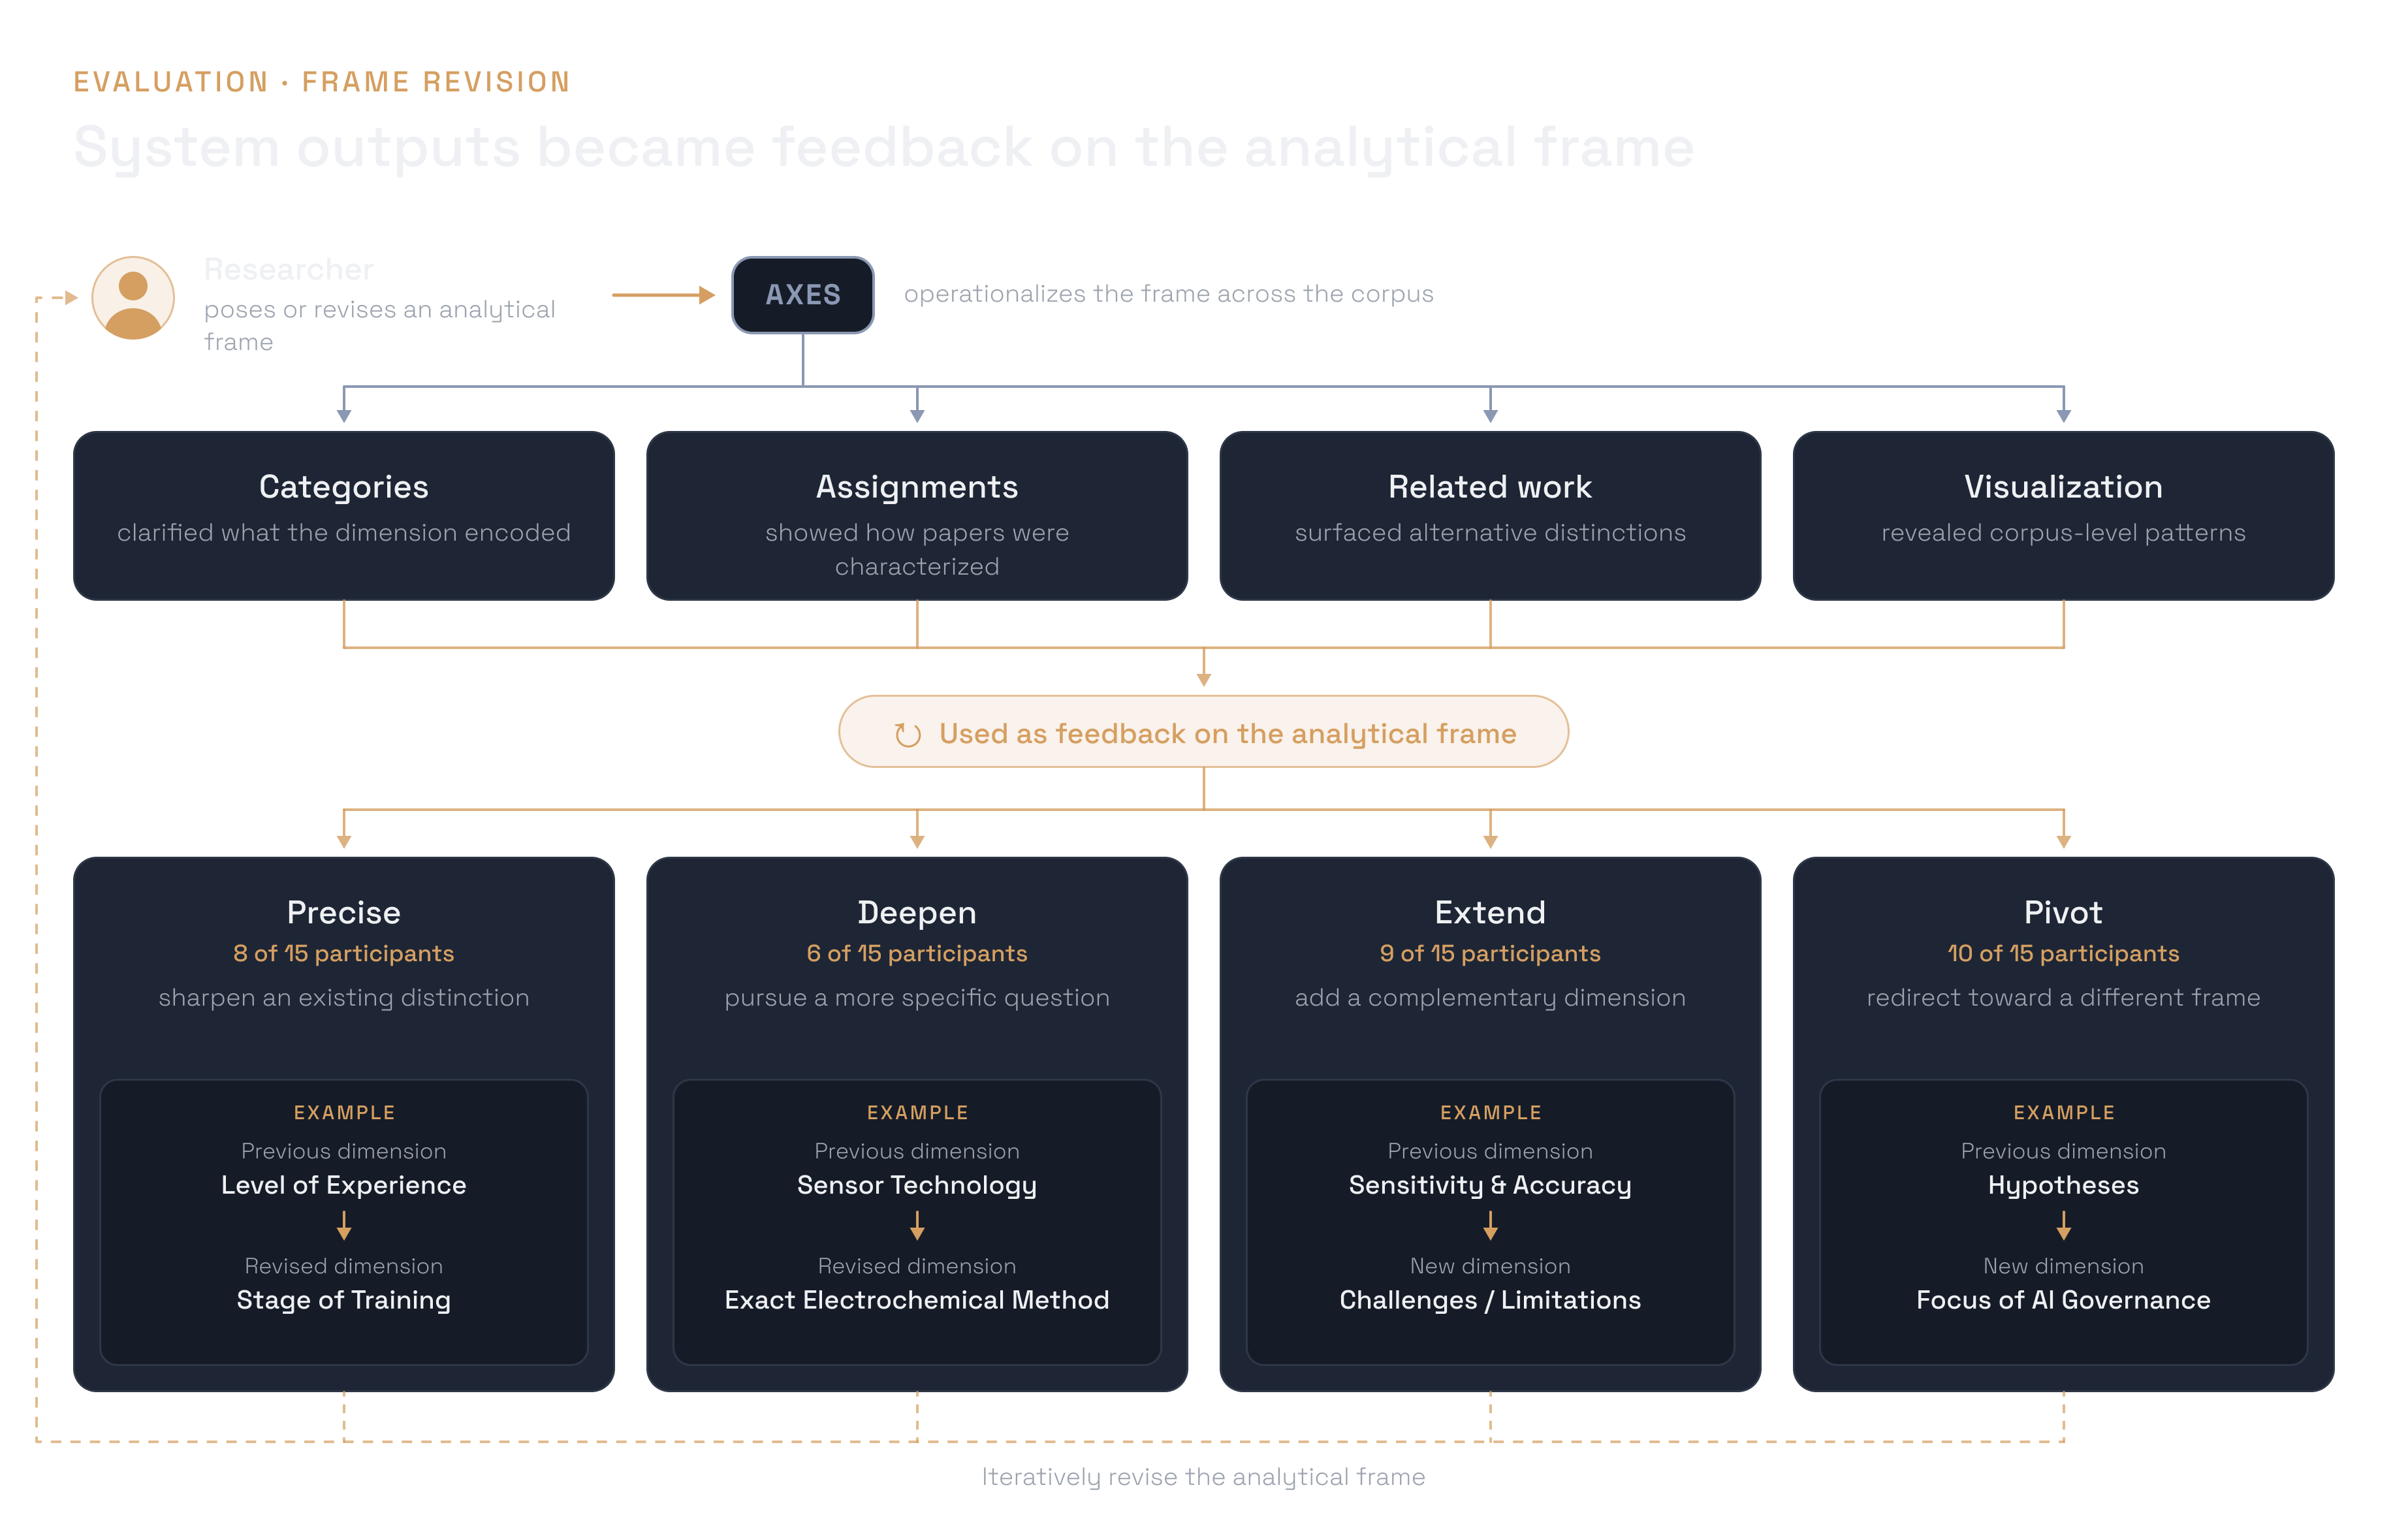
System outputs (categories, per-paper assignments, related work, the visualization) became feedback on the analytical frame itself. 13 of 15 participants revised their frame in response. They made a dimension more precise (8), deepened it (6), extended it (9), or pivoted to a new frame (10).
Key findings
- AI scaffolding didn’t flatten researcher judgment. In the unfamiliar corpus, 61 dimensions grouped into 31 concepts, and 17 of those concepts were pursued by only one participant.
“The visual display puts the analysis back on me… I’m still responsible for making sense of it.” (P8)
- Prior knowledge shifted where initiative began.
- In familiar corpora, 8 of 15 participants started by directly specifying a dimension (median share of directly specified dimensions: 0.50). They used the view to interrogate the field for gaps and outliers.
- In unfamiliar corpora, only 4 of 15 started that way (median share: 0.00). They relied on AI-surfaced dimensions to orient themselves to the field’s terminology and the distinctions experts use.
- Provenance isn’t justification. For concrete dimensions, source passages were enough to verify a value. For interpretive dimensions, participants could see where a value came from but not why the evidence warranted it.
“It tells me the result, but not the criteria.” (P1)
Usability was high: median SUS was 85 and median NASA-TLX was 2.23/7. With no comparison condition, these numbers describe participants’ experience. They are not a measured gain over existing tools.
Implications:
- Treat the analytical frame as a persistent but revisable artifact.
- Adapt the kind of AI initiative to what the user can currently articulate.
- Automate the operations but leave the consequential judgments to the researcher.
- When AI judgments become coordinates in a visualization, explain how the evidence was interpreted, not just where it came from.