
PHORA: AI Survival Predictions in PAH Care
Two systems built on the PHORA risk model for pulmonary arterial hypertension: a clinician dashboard for counterfactual reasoning about survival predictions, and ourPHORA, a patient-facing redesign. We evaluated ourPHORA with 44 patients and caregivers; an in-clinic study pairing patients with their clinicians is ongoing.
Clinical Decision Support
Human-AI Interaction
| My role | Led the formative study, system design, and evaluation study design; conducted all data analysis. Co-authors provided clinical expertise and supported data collection. |
| Methods | Semi-structured interviews · design probes · thematic analysis and affinity diagramming · personas · interactive visualization design · think-aloud · mixed-methods evaluation (paired Wilcoxon signed-rank) |
TL;DR. Clinicians use AI survival scores to interpret patient data; patients get raw numbers in a portal. I designed and evaluated ourPHORA, the first system (to our knowledge) that gives patients interactive control over an AI-derived survival assessment. Patients used the score less as a prediction and more as a lens that made the rest of their clinical data interpretable.
1. Background: PAH and AI Survival Scores
Pulmonary arterial hypertension (PAH) is a rare, progressive, incurable disease requiring lifelong monitoring of dozens of clinical variables (e.g., 6-Minute Walk Distance, NT-proBNP) and repeated treatment decisions made through shared decision-making (SDM).
AI survival assessments estimate a patient’s probability of surviving a fixed period. In PAH, validated risk models such as REVEAL and COMPERA are embedded in international guidelines as a basis for treatment escalation. Our work uses PHORA, a Bayesian model that outputs a one-year survival probability (0–100%) stratified into three categories:
| PHORA output | Clinical category | ourPHORA (patient-friendly) label |
|---|---|---|
| > 95% | Low risk | Optimal disease control |
| 90–95% | Intermediate risk | Intermediate disease control |
| < 90% | High risk | Suboptimal disease control |
Today, these scores are used only by clinicians.
2. Clinician-Facing Interface
Morrison et al., “It’s Not Just for Trust: Designing for Emerging Uses of Explainable AI in Clinical Decision-Making,” ACM Transactions on Computing for Healthcare, 2026. I contributed to development of the dashboard; I am not an author.
The PHORA Dashboard is a clinician-facing decision-support system designed through iterative prototyping with 18 PAH clinicians and then used as a design probe with 7 physicians. It shows patient variables and their trends, the risk prediction over time, interactive “what-if” exploration (partial-dependence bars that update together, with comparable saved scenarios), and treatment guideline recommendations.
Clinicians described uses beyond trusting the model, including explaining risk to patients, motivating treatment adherence, and engaging patients in treatment planning. The paper named the absence of patient perspectives as its key limitation, and that is where my work begins. The dashboard also served as the design probe in my formative study.
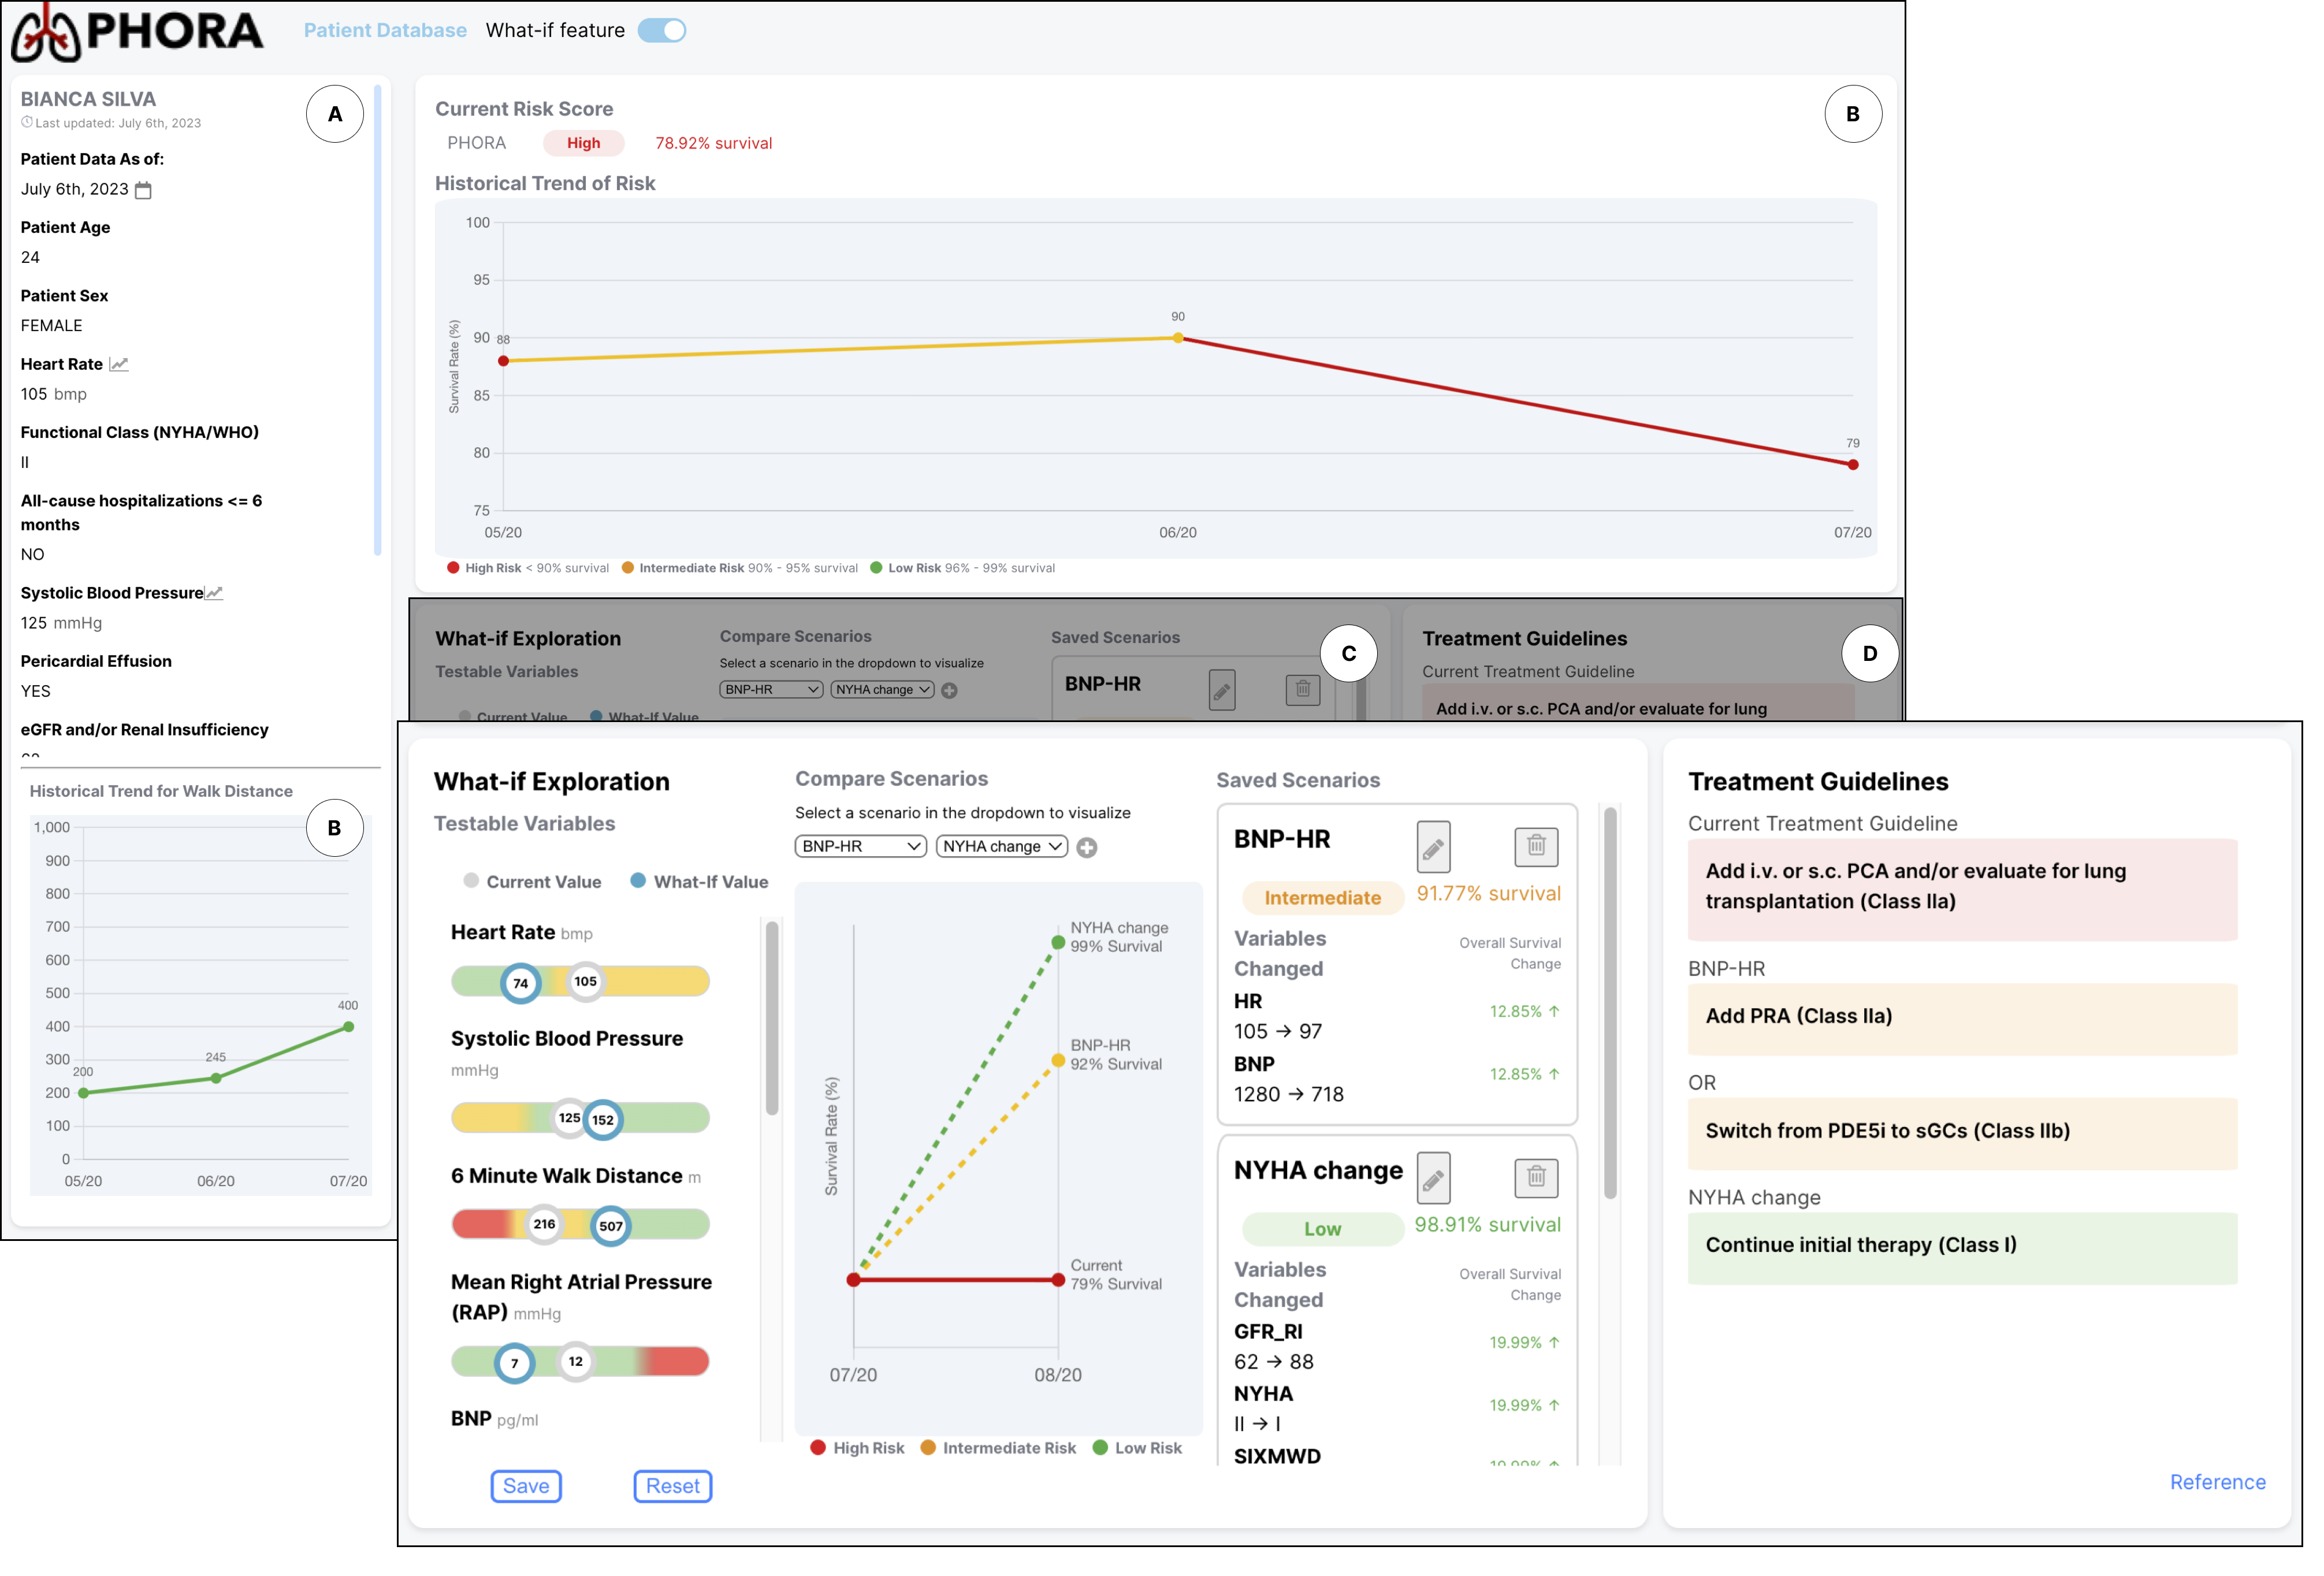
Clinician Facing PHORA dashboard showing patient variables (A), historical trends (B), counterfactual explanations (C), and treatment recommendations (D).
3. How Do We Show This to Patients?
The problem. Patient portals give patients test results and measurements, but not the expertise to interpret them. The result is information overload rather than meaningful participation in SDM. Clinicians, by contrast, have an interpretive anchor in AI risk scores.
The gap. HCI work on explainable AI and risk communication has focused on clinicians. Where patients are involved, they are either generic laypeople or passive viewers guided through a clinician-driven interface. The patient is the subject of the survival prediction, but never the audience of the explanation.
Research questions
| Phase | Questions |
|---|---|
| Formative | F-RQ1: What are PAH patients’ current practices and unmet needs for managing care? F-RQ2: How do patients perceive AI-based survival assessments? |
| Evaluation | E-RQ1: How does ourPHORA compare with existing tools? E-RQ2: How does it influence perceived comprehension? E-RQ3: How does it influence communication with clinicians? E-RQ4: How does it influence motivation for self-management? |
Hypothesis. A survival score collapses many unintuitive clinical variables into one intelligible quantity. It could therefore give patients the context they need to explore the rest of their data. This changes the evaluation question from “Did the patient understand the risk?” to “What else did the patient understand because of the risk?”
4. Formative Study
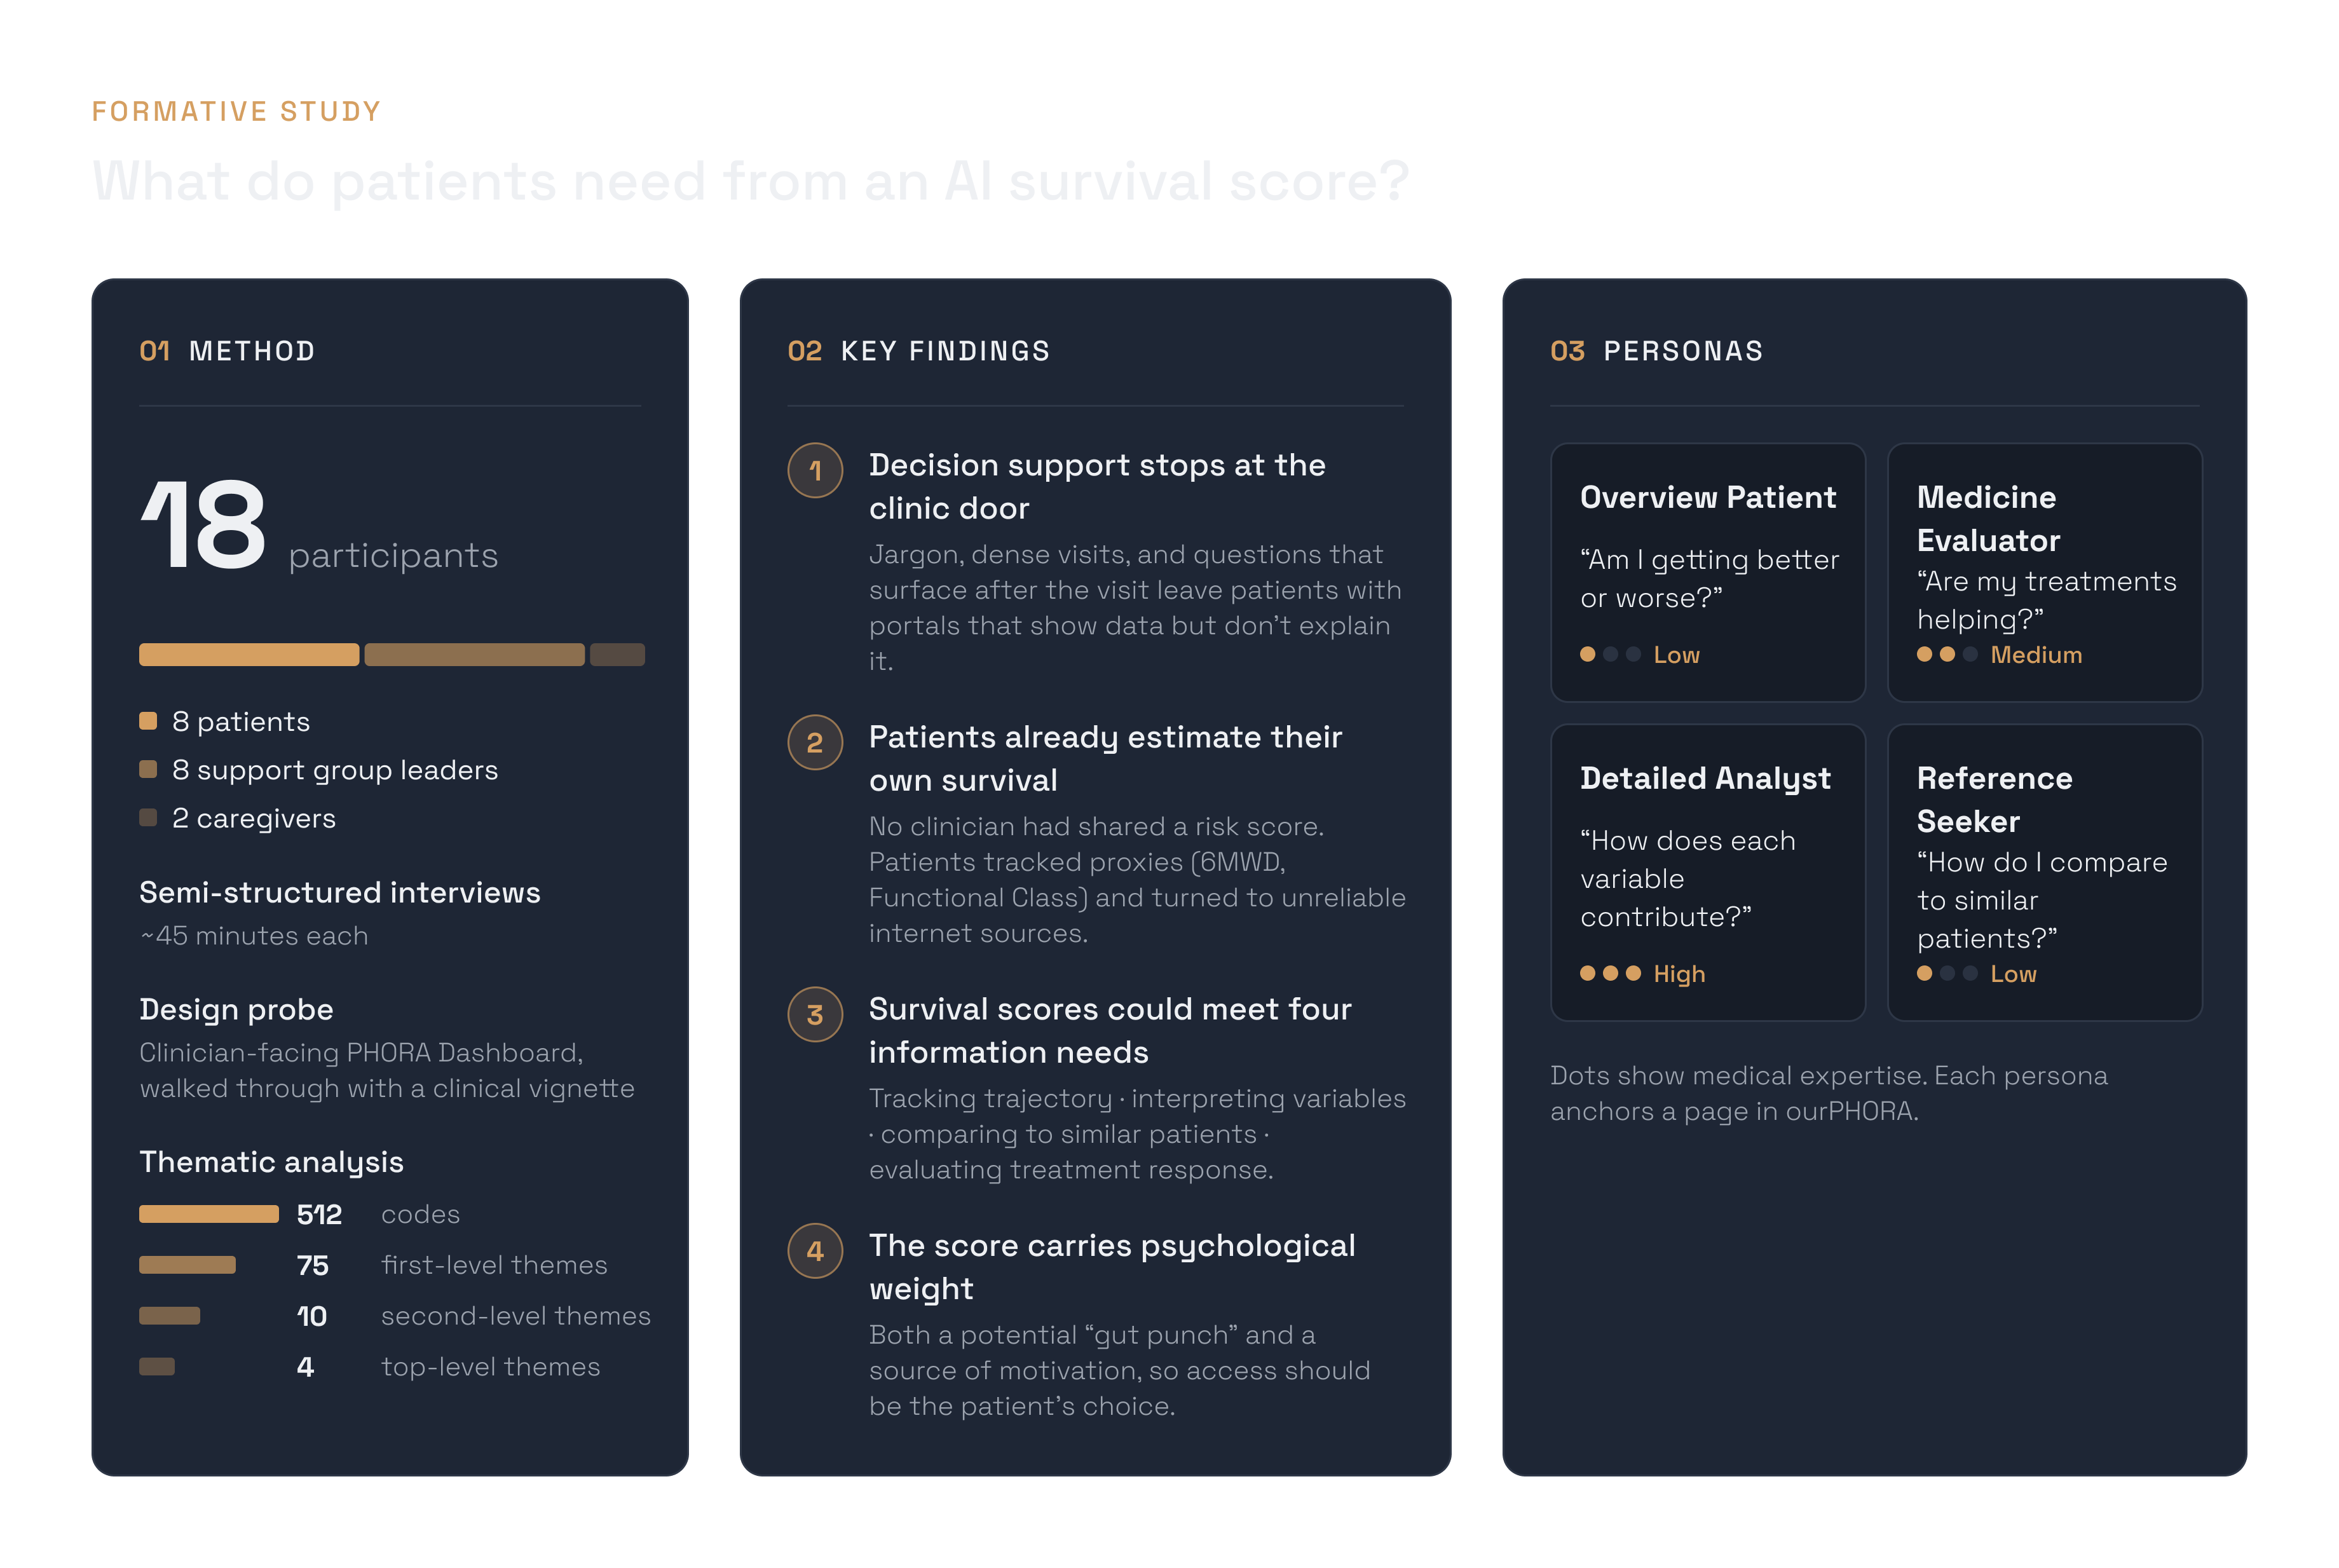
I interviewed 18 people (8 patients, 8 support group leaders, 2 caregivers), using the clinician-facing PHORA Dashboard as a design probe. Participants were already estimating their own survival from proxies and unreliable internet sources, because no clinician had shared a risk score with them. They wanted the score to answer four distinct questions, which I synthesized into four personas.
5. Tool Design
ourPHORA is a web-based dashboard that turns a patient’s visit data into PHORA scores and visualizations, for use between visits and in consultation. Each page is built around one or more personas:
Overview (all personas): risk status gauge, score trend, and a plain-language summary. Health Metrics (Detailed Analyst, Reference Seeker): SHAP-ranked variables, history, comparison to similar patients, and real-time what-if exploration with goal-setting. Treatments (Medicine Evaluator): medication timeline aligned with the risk trajectory.
6. Evaluation
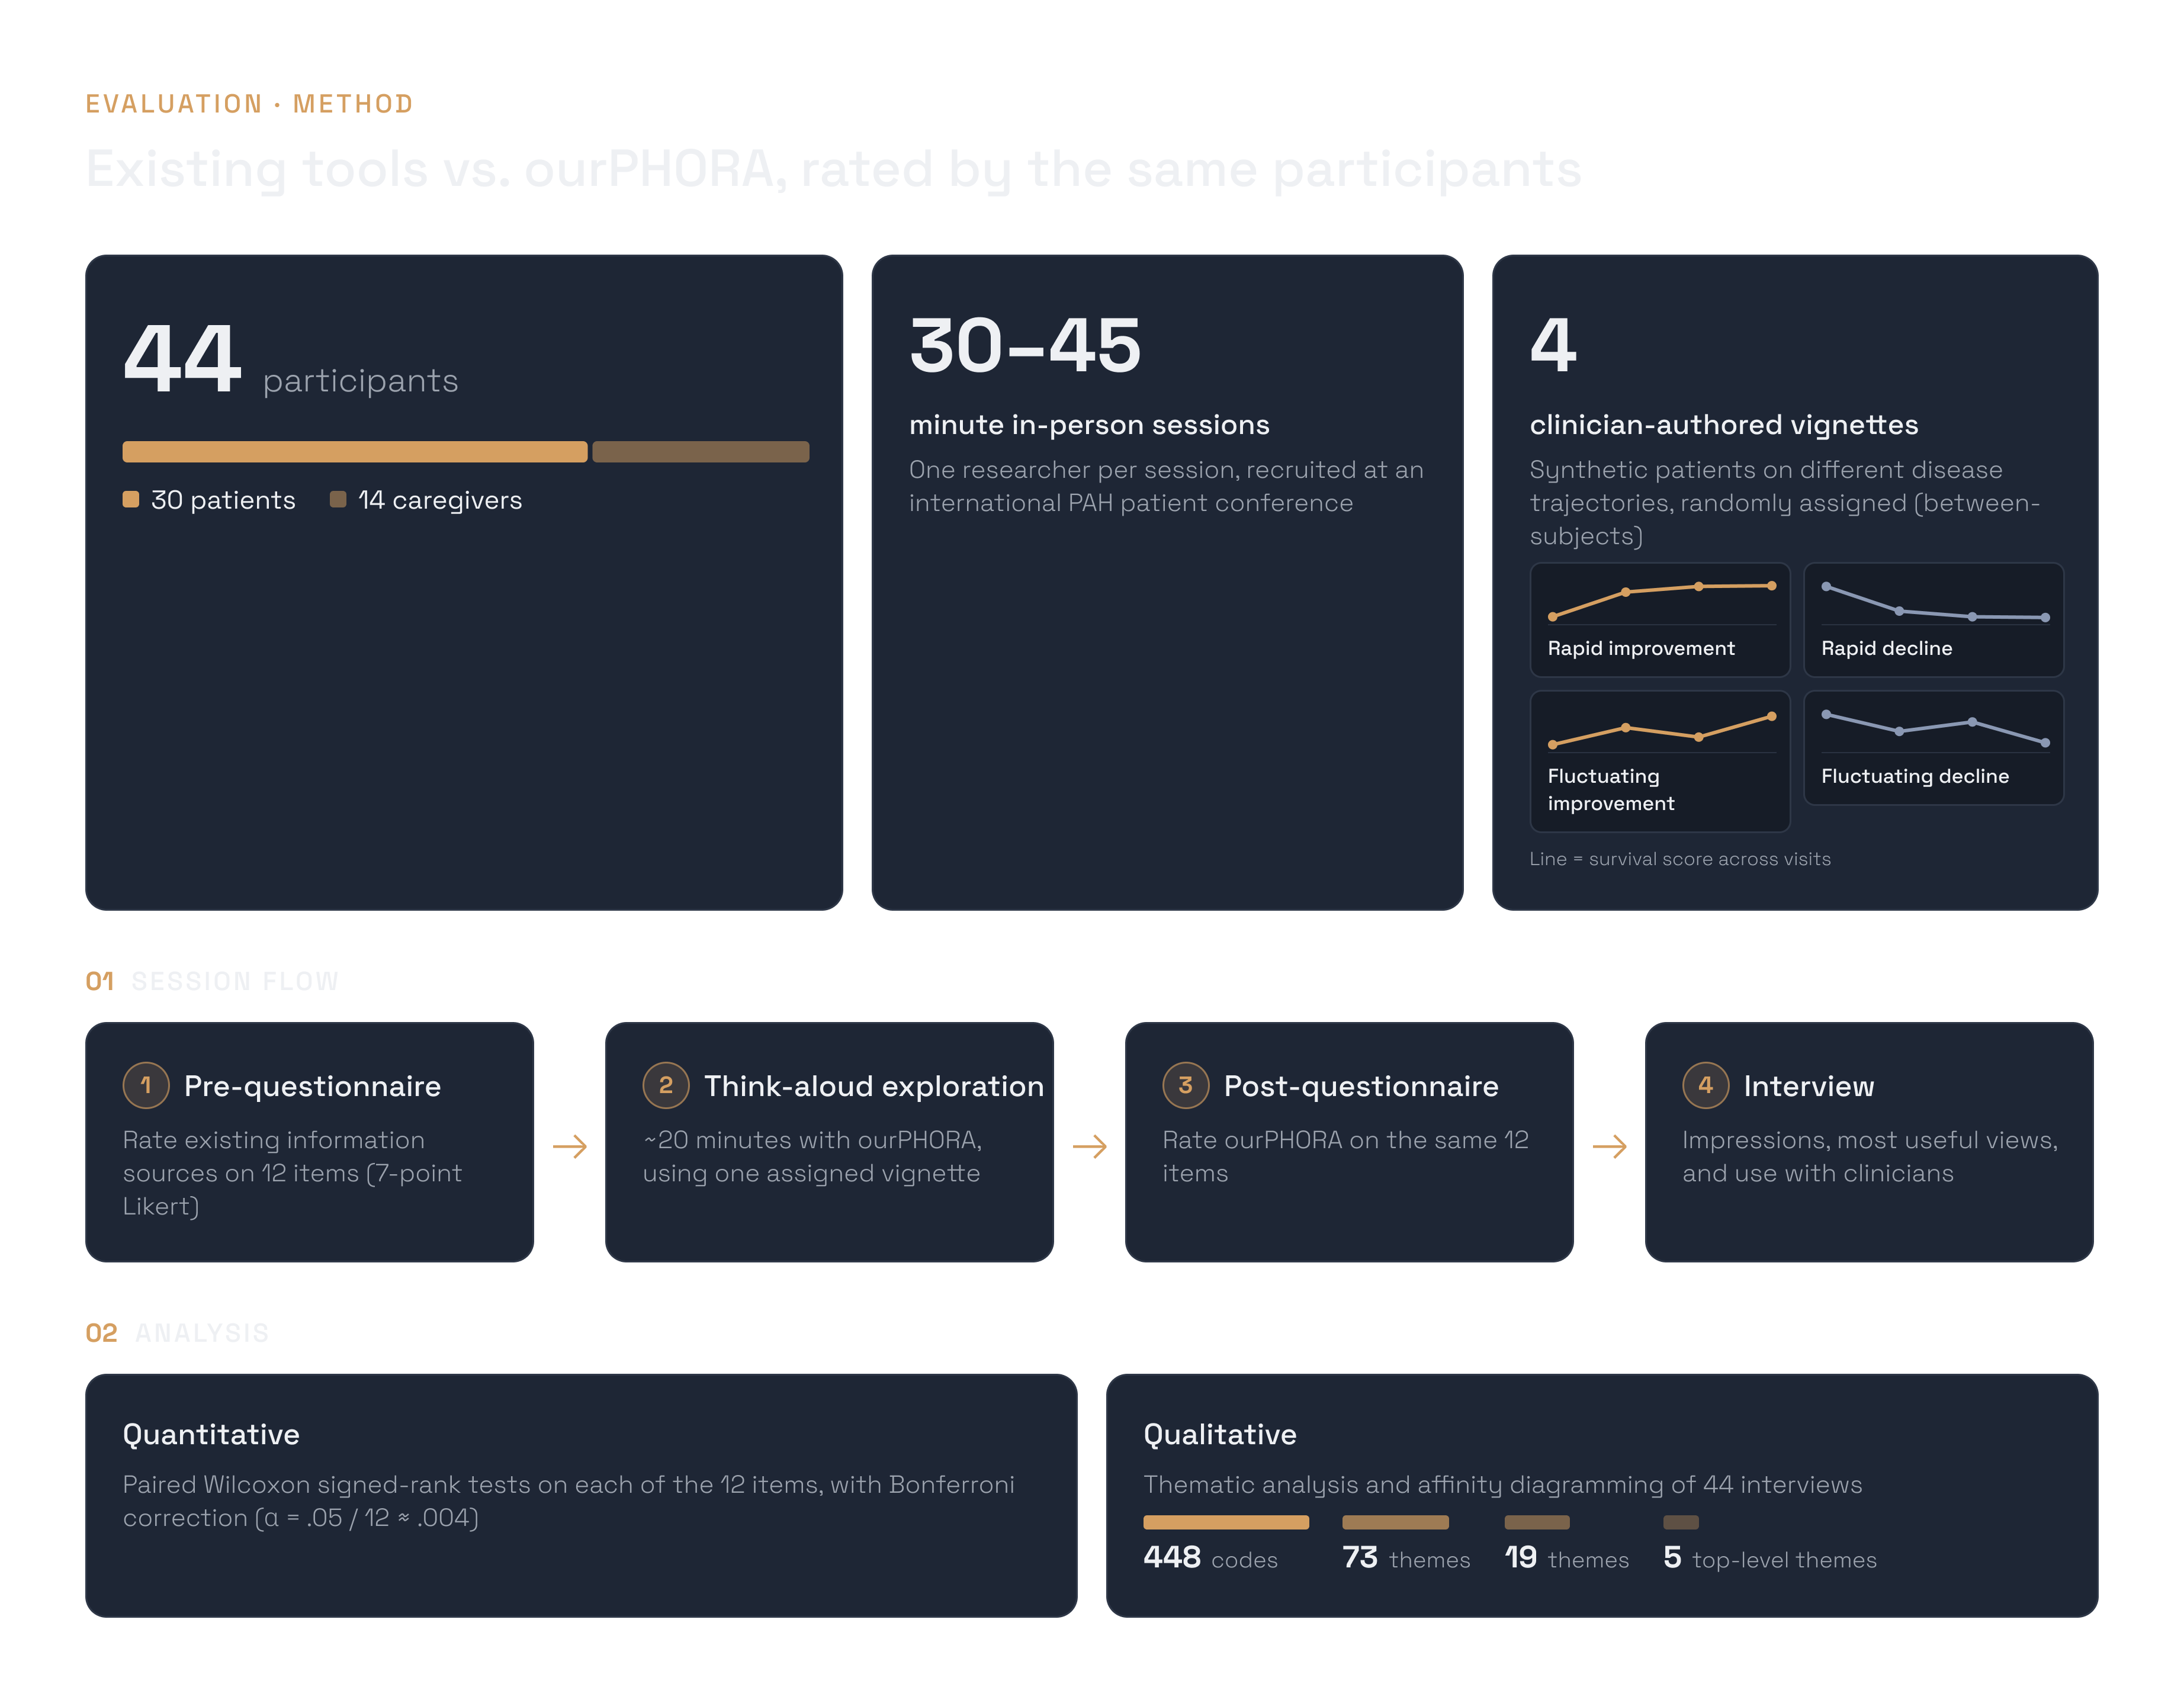
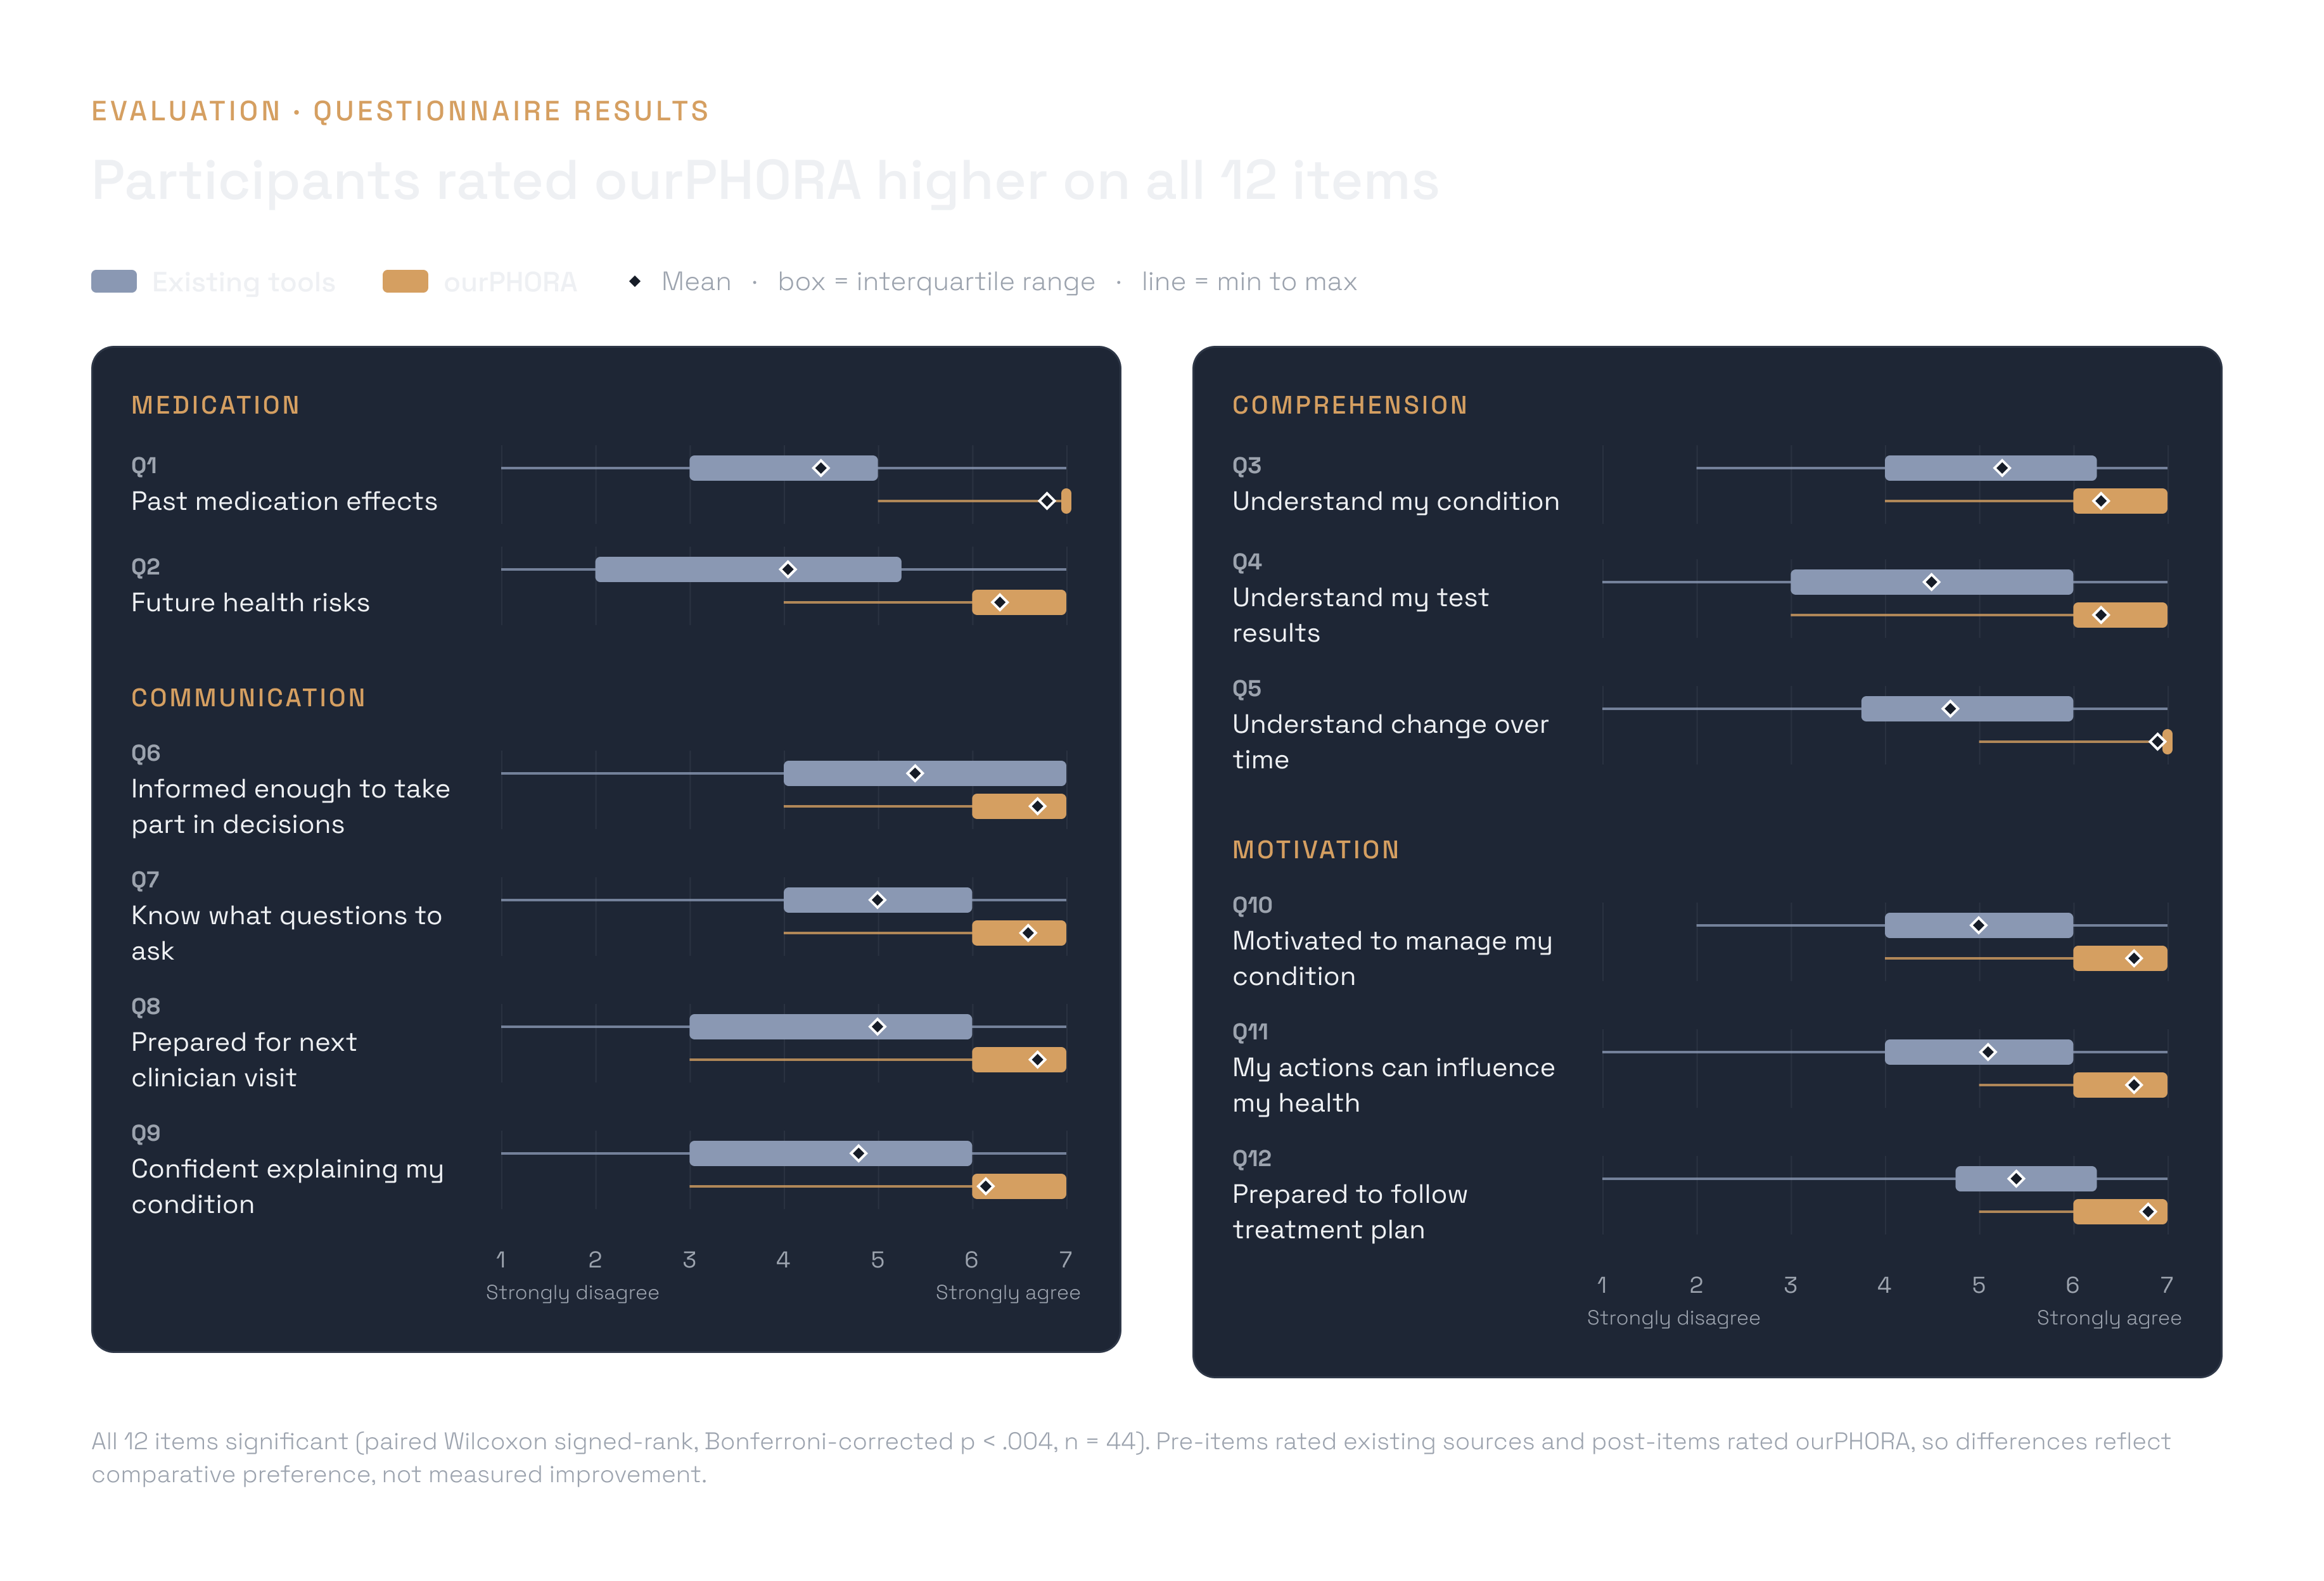
I designed a mixed-methods study with 44 patients and caregivers. Each participant explored ourPHORA with one of four clinician-authored vignettes, then rated it against their existing information sources. Participants rated ourPHORA higher on all 12 items (p < .004). This is a comparative preference, not a measured gain in comprehension.
The central finding: patients used the score less as a prediction and more as a lens that made the rest of their clinical data interpretable.
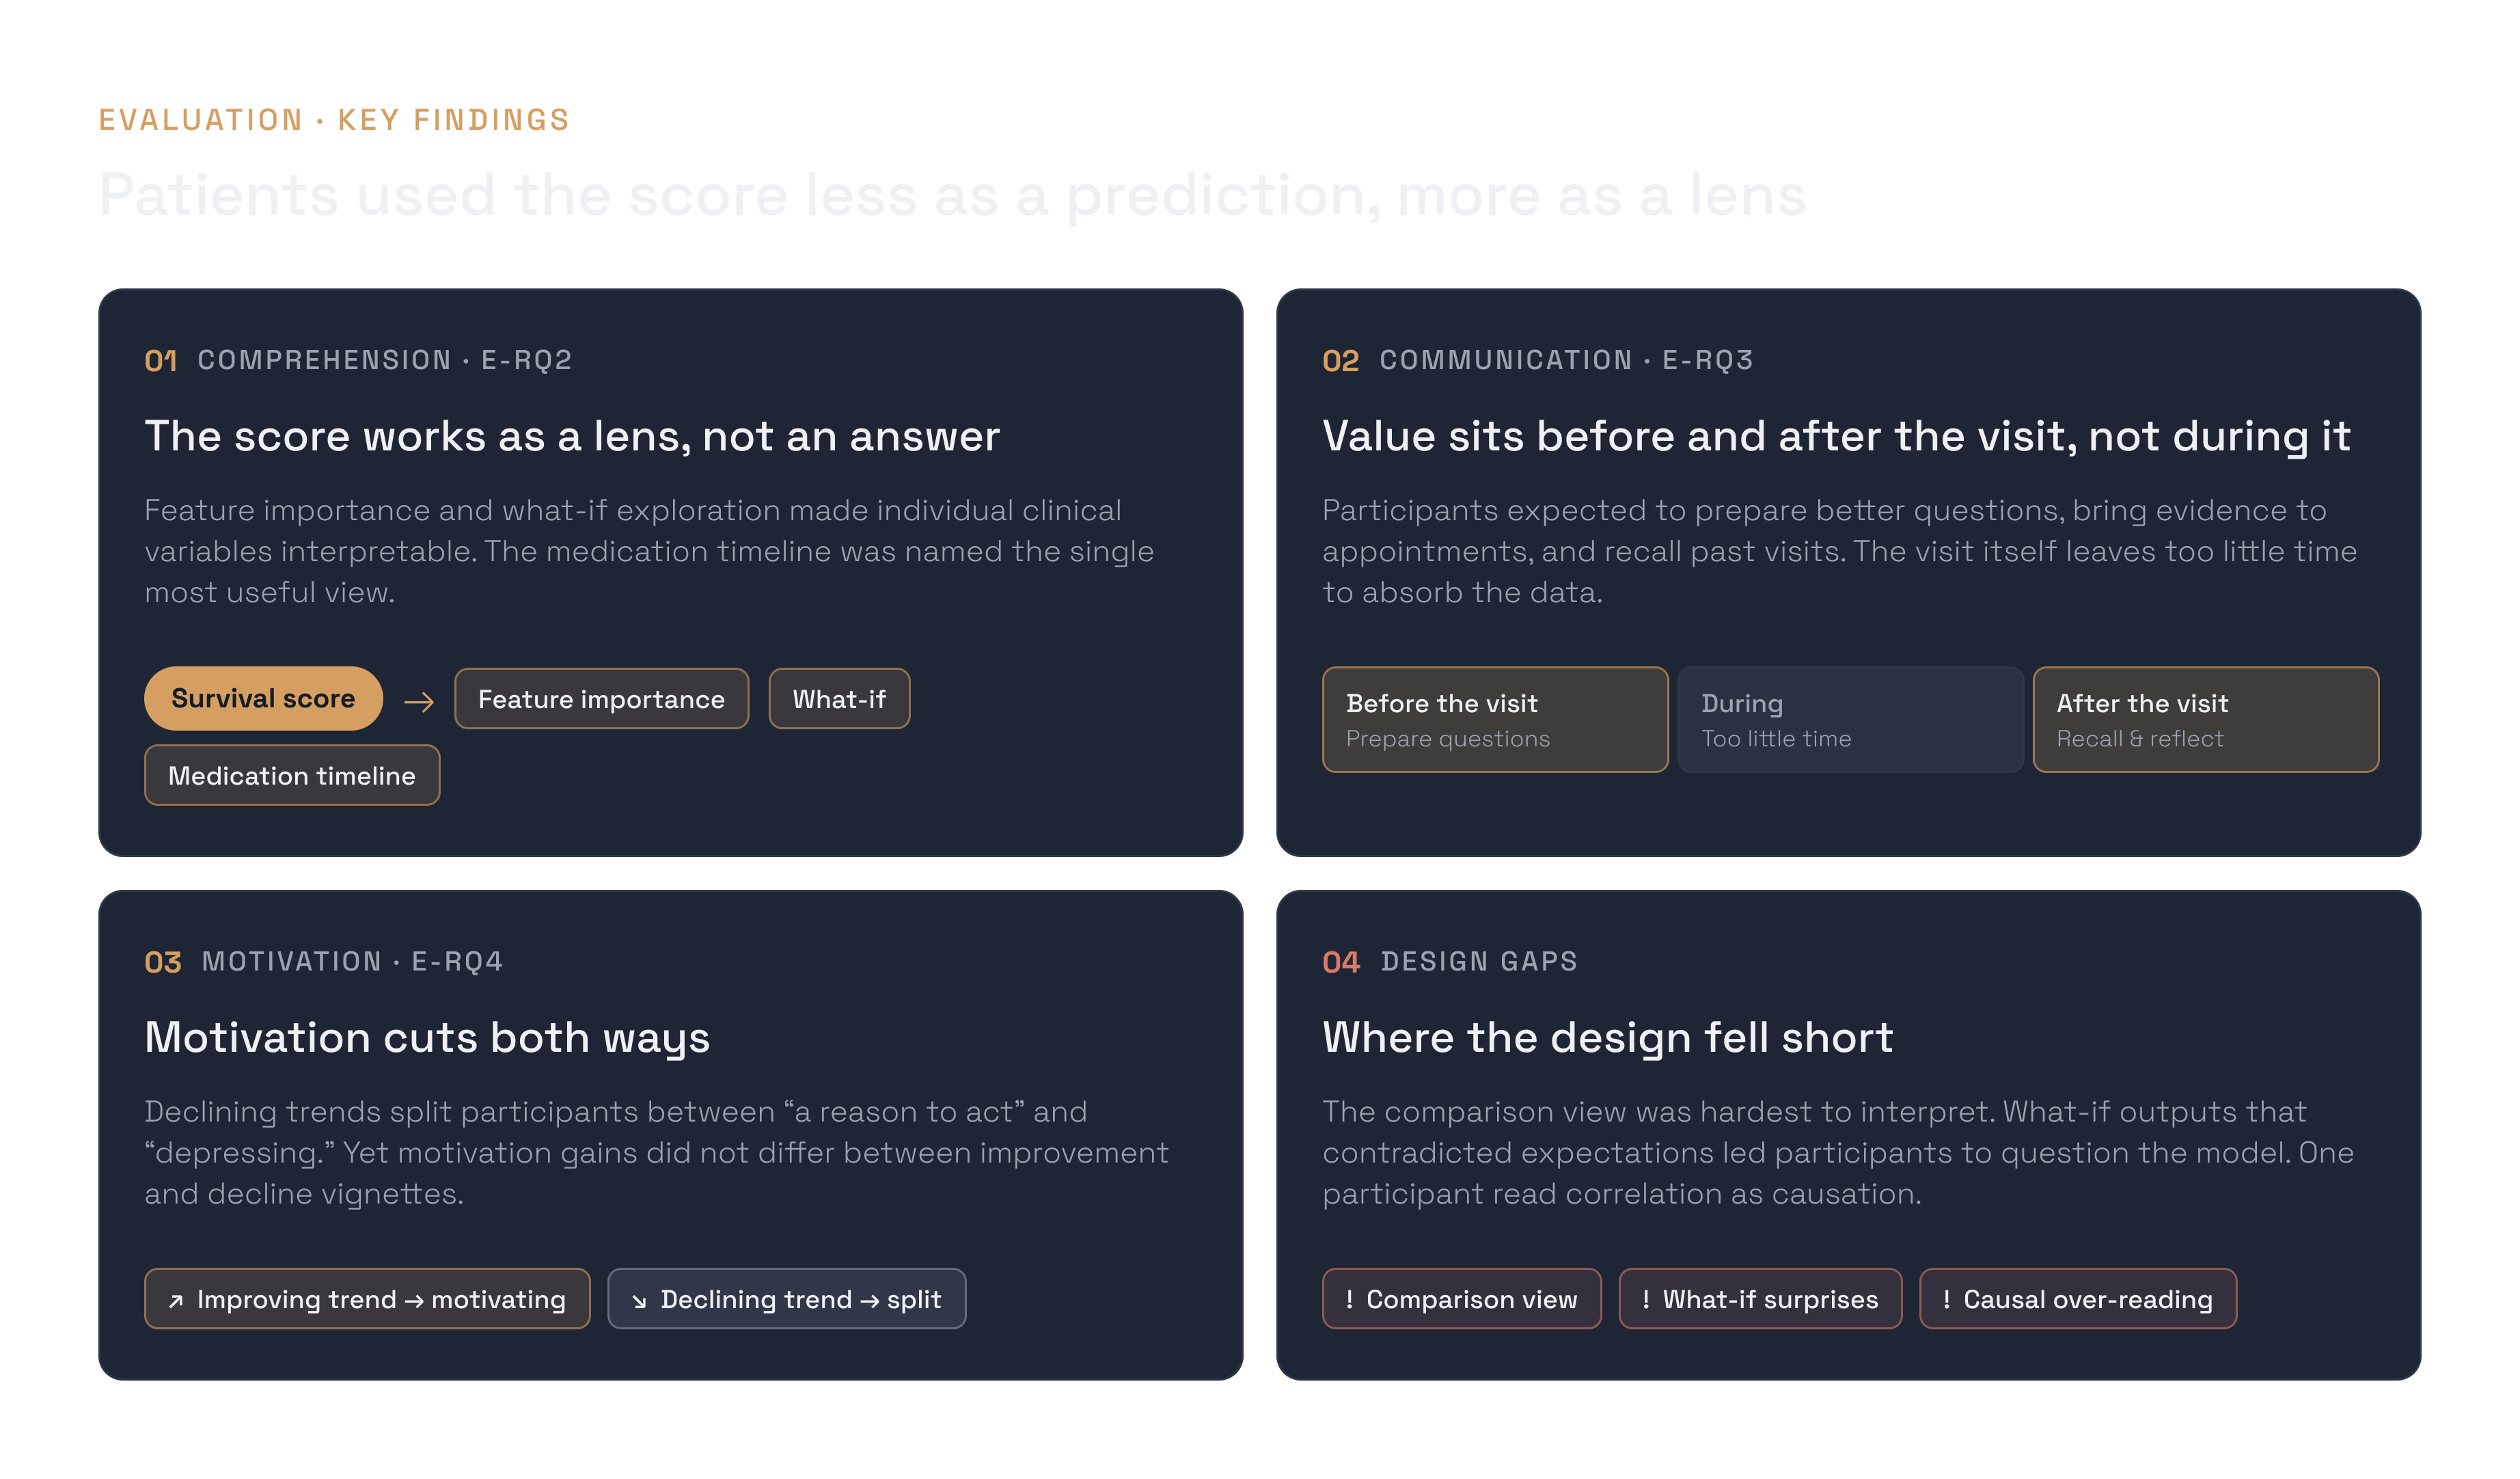
Implications: design an explorable structure around the risk score rather than just a risk output; make patient-facing risk tools asynchronous by default; and control disclosure rather than withhold it.
7. Next Steps
The evaluation measured perceptions, after one session, using synthetic vignettes. Its central claim, that ourPHORA supports SDM, still needs to be tested with real patients and real clinical encounters. We are now running a clinical integration study at Cedars-Sinai Medical Center with patients and clinicians. It moves ourPHORA from anticipated use to observed use in clinical care, focusing on:
- Whether the communication benefits participants anticipated show up in actual patient–clinician conversations
- How clinicians respond to patients who arrive informed by an AI survival assessment
- Which guardrails keep patient-facing risk tools a complement to SDM rather than a substitute for it